

On this page
Reports (/reports) gathers the business’s reports in sections — sales,
inventory, kitchen, bar, café, procurement, customers, events and the
accounts — with an overview of today and the month on the first page. Every
figure is read from what was recorded, so a report and the accounts agree.
Who sees what:
| You can | You need |
|---|---|
| Open Reports and the Sales section | reports.view |
| Inventory / Kitchen / Bar / Café / Procurement / Customers / Events | also inventory.view / production.view / beverage.reports / cafe.reports / procurement.view / customers.view / events.reports |
| Accounting (profit and loss, balance sheet, cash flow, expenses, cost of sales) | also reports.financial and accounting.view, every branch |
| Sales by cashier and by waiter | also performance.view |
| Cost and margin columns | also menu.costs |
| PDF, Excel and CSV files | reports.export |
Your role counts branch by branch: if you manage one branch, the reports show that branch. On a shared till signed in with a PIN, the sensitive permissions are not used — sign in with your password to see them.
The screens are the demo business on Friday 2 October 2026, read by Moses Kigozi, the branch manager at Kampala — Kololo. Figures move all day as the tills trade.
Read the reports overview
Purpose
See how the business is doing today and this month, and what needs acting on, before opening any single report.
Role / permission required
Owners, managers, accountants and anyone given reports: reports.view.
Prerequisites
- None.
Steps
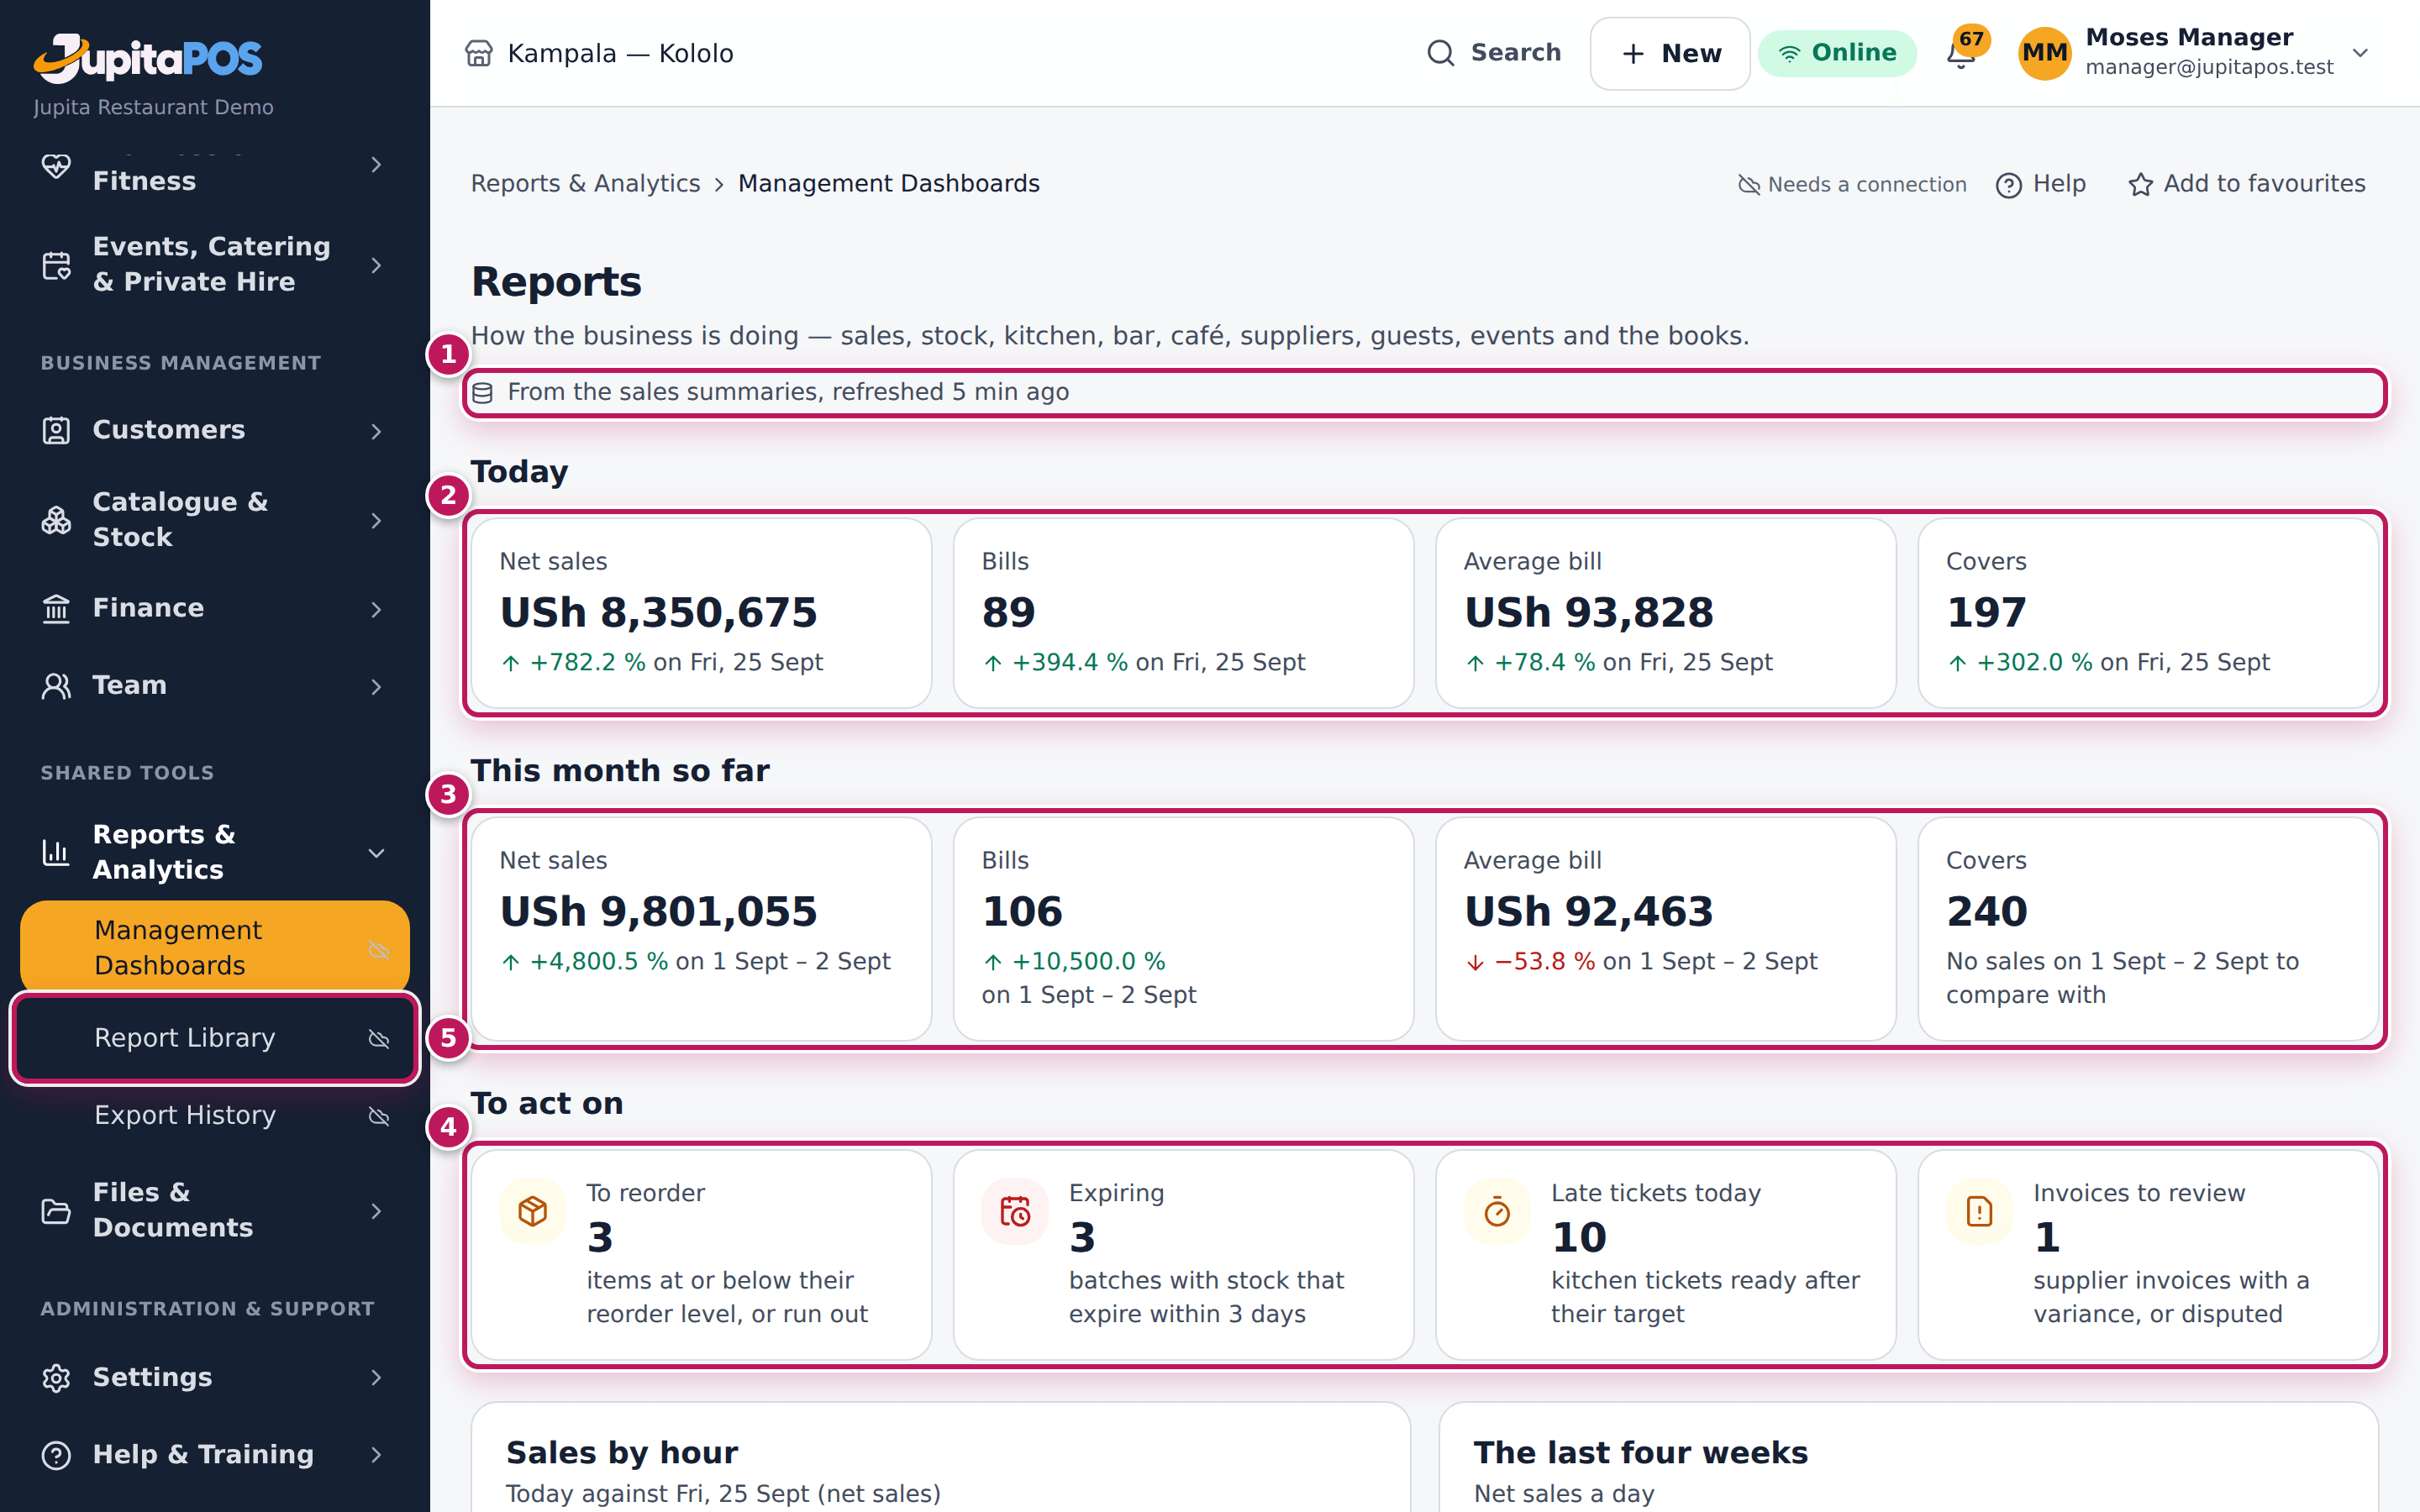
- Open Reports & Analytics › Management Dashboards in the menu (or the Overview’s sales card). Report Library (5), next to it in the menu, holds every section you may open as tabs.
- Read the line under the title (1): the figures come From the sales summaries and when they were refreshed.
- Read Today (2) against the same weekday last week: Net sales, Bills, Average bill, Covers, each with the change.
- Read This month so far (3) against the same days of last month.
- Read To act on (4): items to reorder, batches expiring within three days, kitchen tickets late today, supplier invoices to review. Each opens the report behind it.
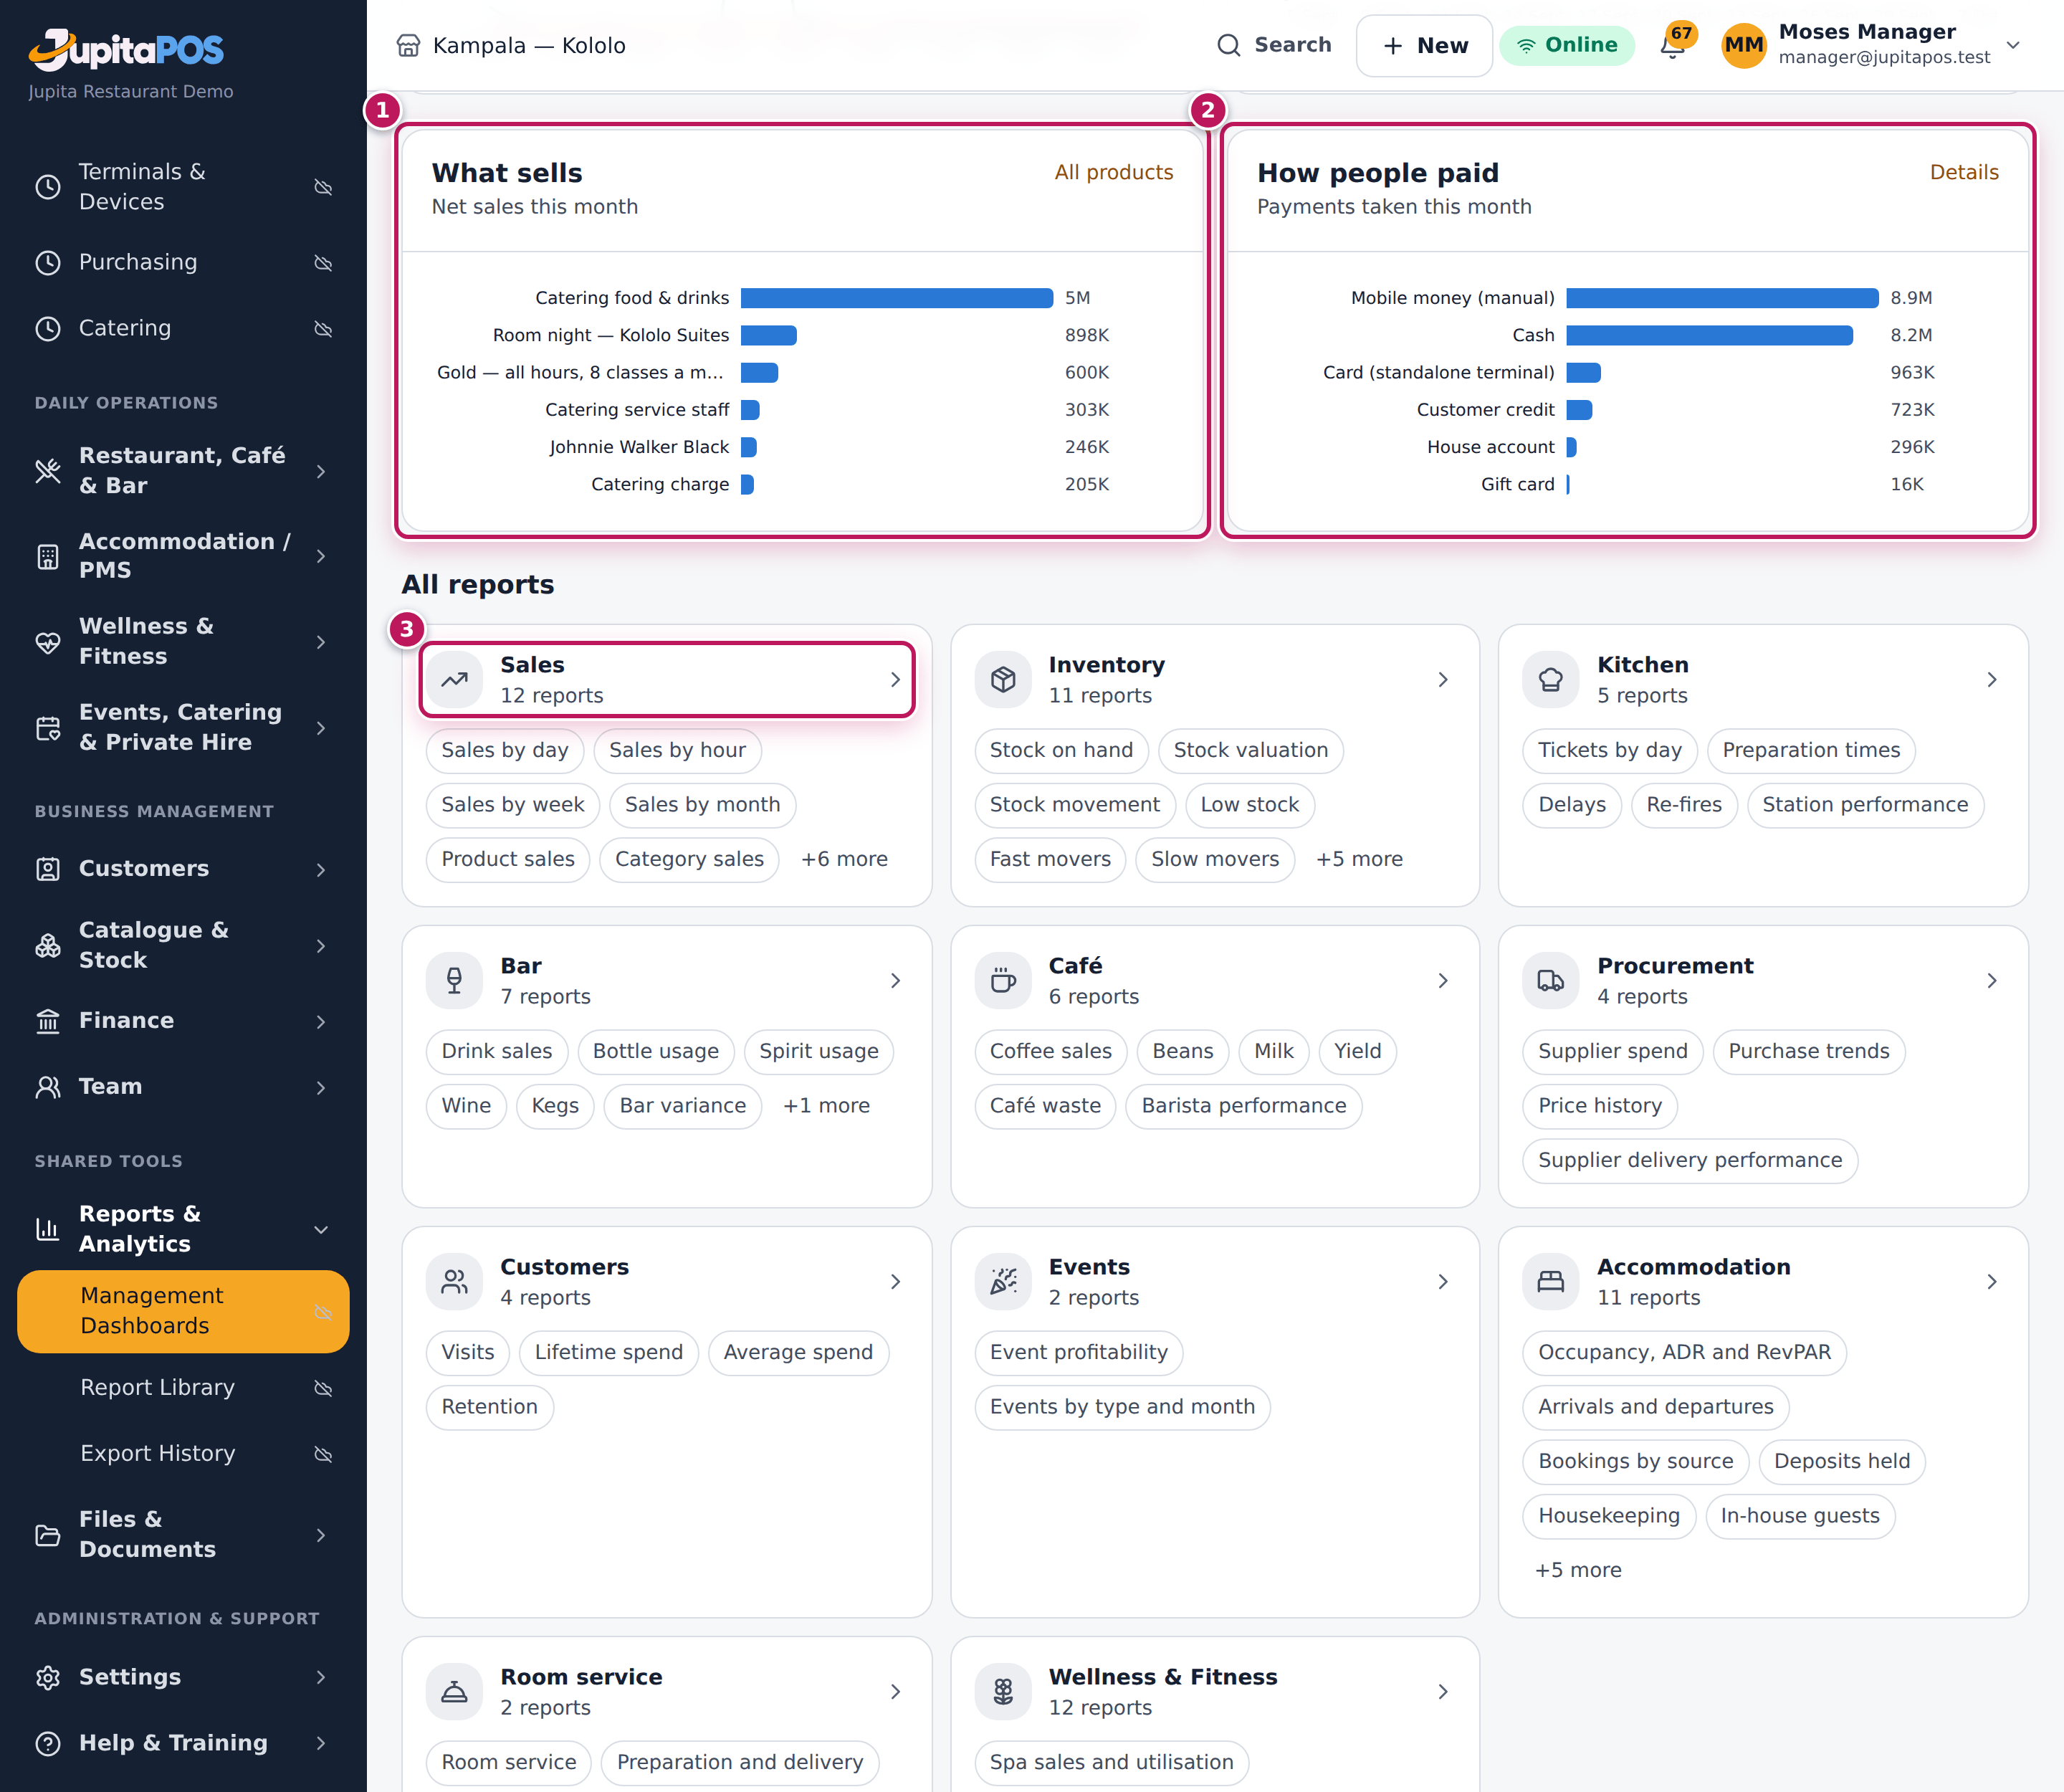
- Scroll down: Sales by hour today, The last four weeks, What sells (1) this month, Branches and How people paid (2).
- Under All reports, click a section (3) or one of its reports.
Expected result
You see today’s net sales, bills, average bill and covers with the change on last week, the month so far, and a short list of things to do. Each number under To act on is the number of rows of the report it opens.
Screenshot
Common mistakes
- Comparing today at noon with last Friday’s whole day. Today is compared with the same weekday; late in the day the comparison is fair.
- Reading “No sales on … to compare with” as a fault. The period before had no trading: in the demo, This month so far compares 1–2 October with 1–2 September, and the restaurant only started trading on 21 September.
Troubleshooting
- A section is missing. Your role does not include that section’s permission (see the table above).
- “You don’t have access to this” on Reports. Your role does not
include
reports.view.
Open a report and filter it
Purpose
Get exactly the figures you need — a period, a branch, a comparison — with the chart and the full table.
Role / permission required
reports.view, plus the section’s permission.
Prerequisites
- None.
Steps
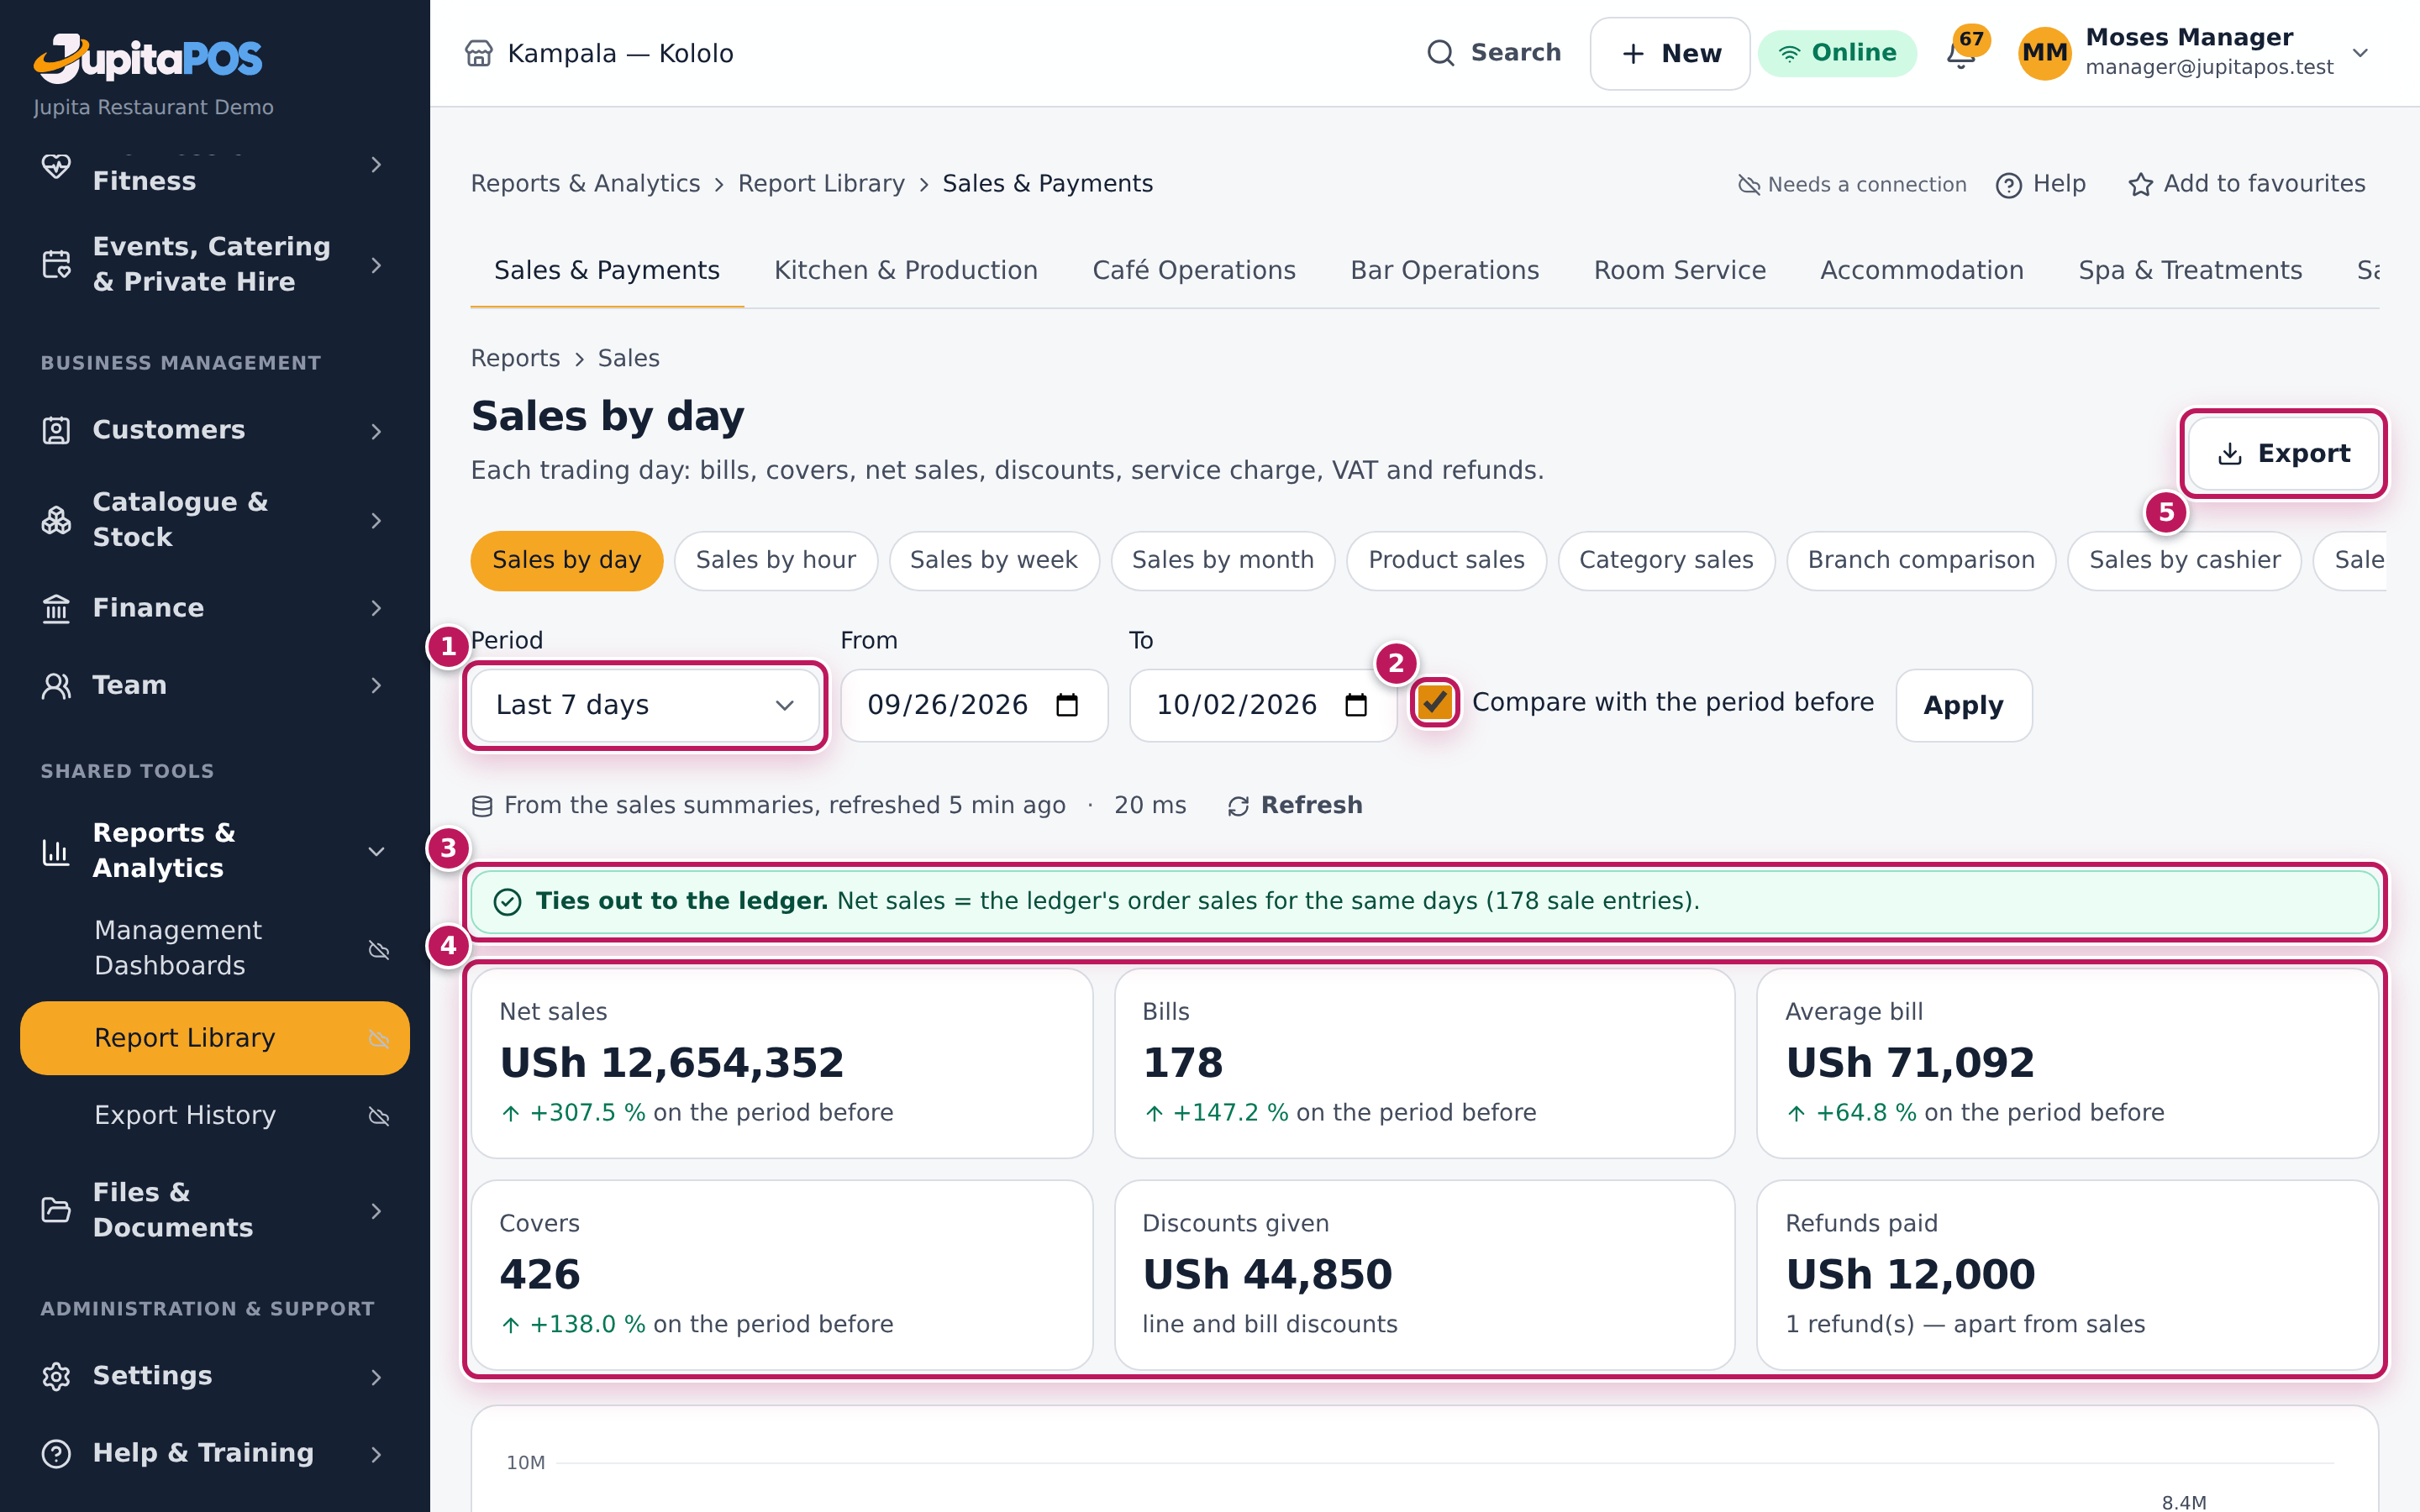
- On Reports, click a section — Sales — and then a report — Sales by day.
- Choose the Period (1): Today, Yesterday, Last 7 days, Last 30 days, This month, Last month, Last 90 days, This year, Last 12 months, or type From and To and click Apply. Reports of now (stock on hand) have no period; the balance sheet takes As at.
- If you work at more than one branch, choose the Branch, or every branch you may see. With one branch there is nothing to choose.
- Tick Compare with the period before (2) where it is offered: the same number of days just before.
- Read the check (3) — it should say Ties out to the ledger — and the key figures (4) with the change on the period before.
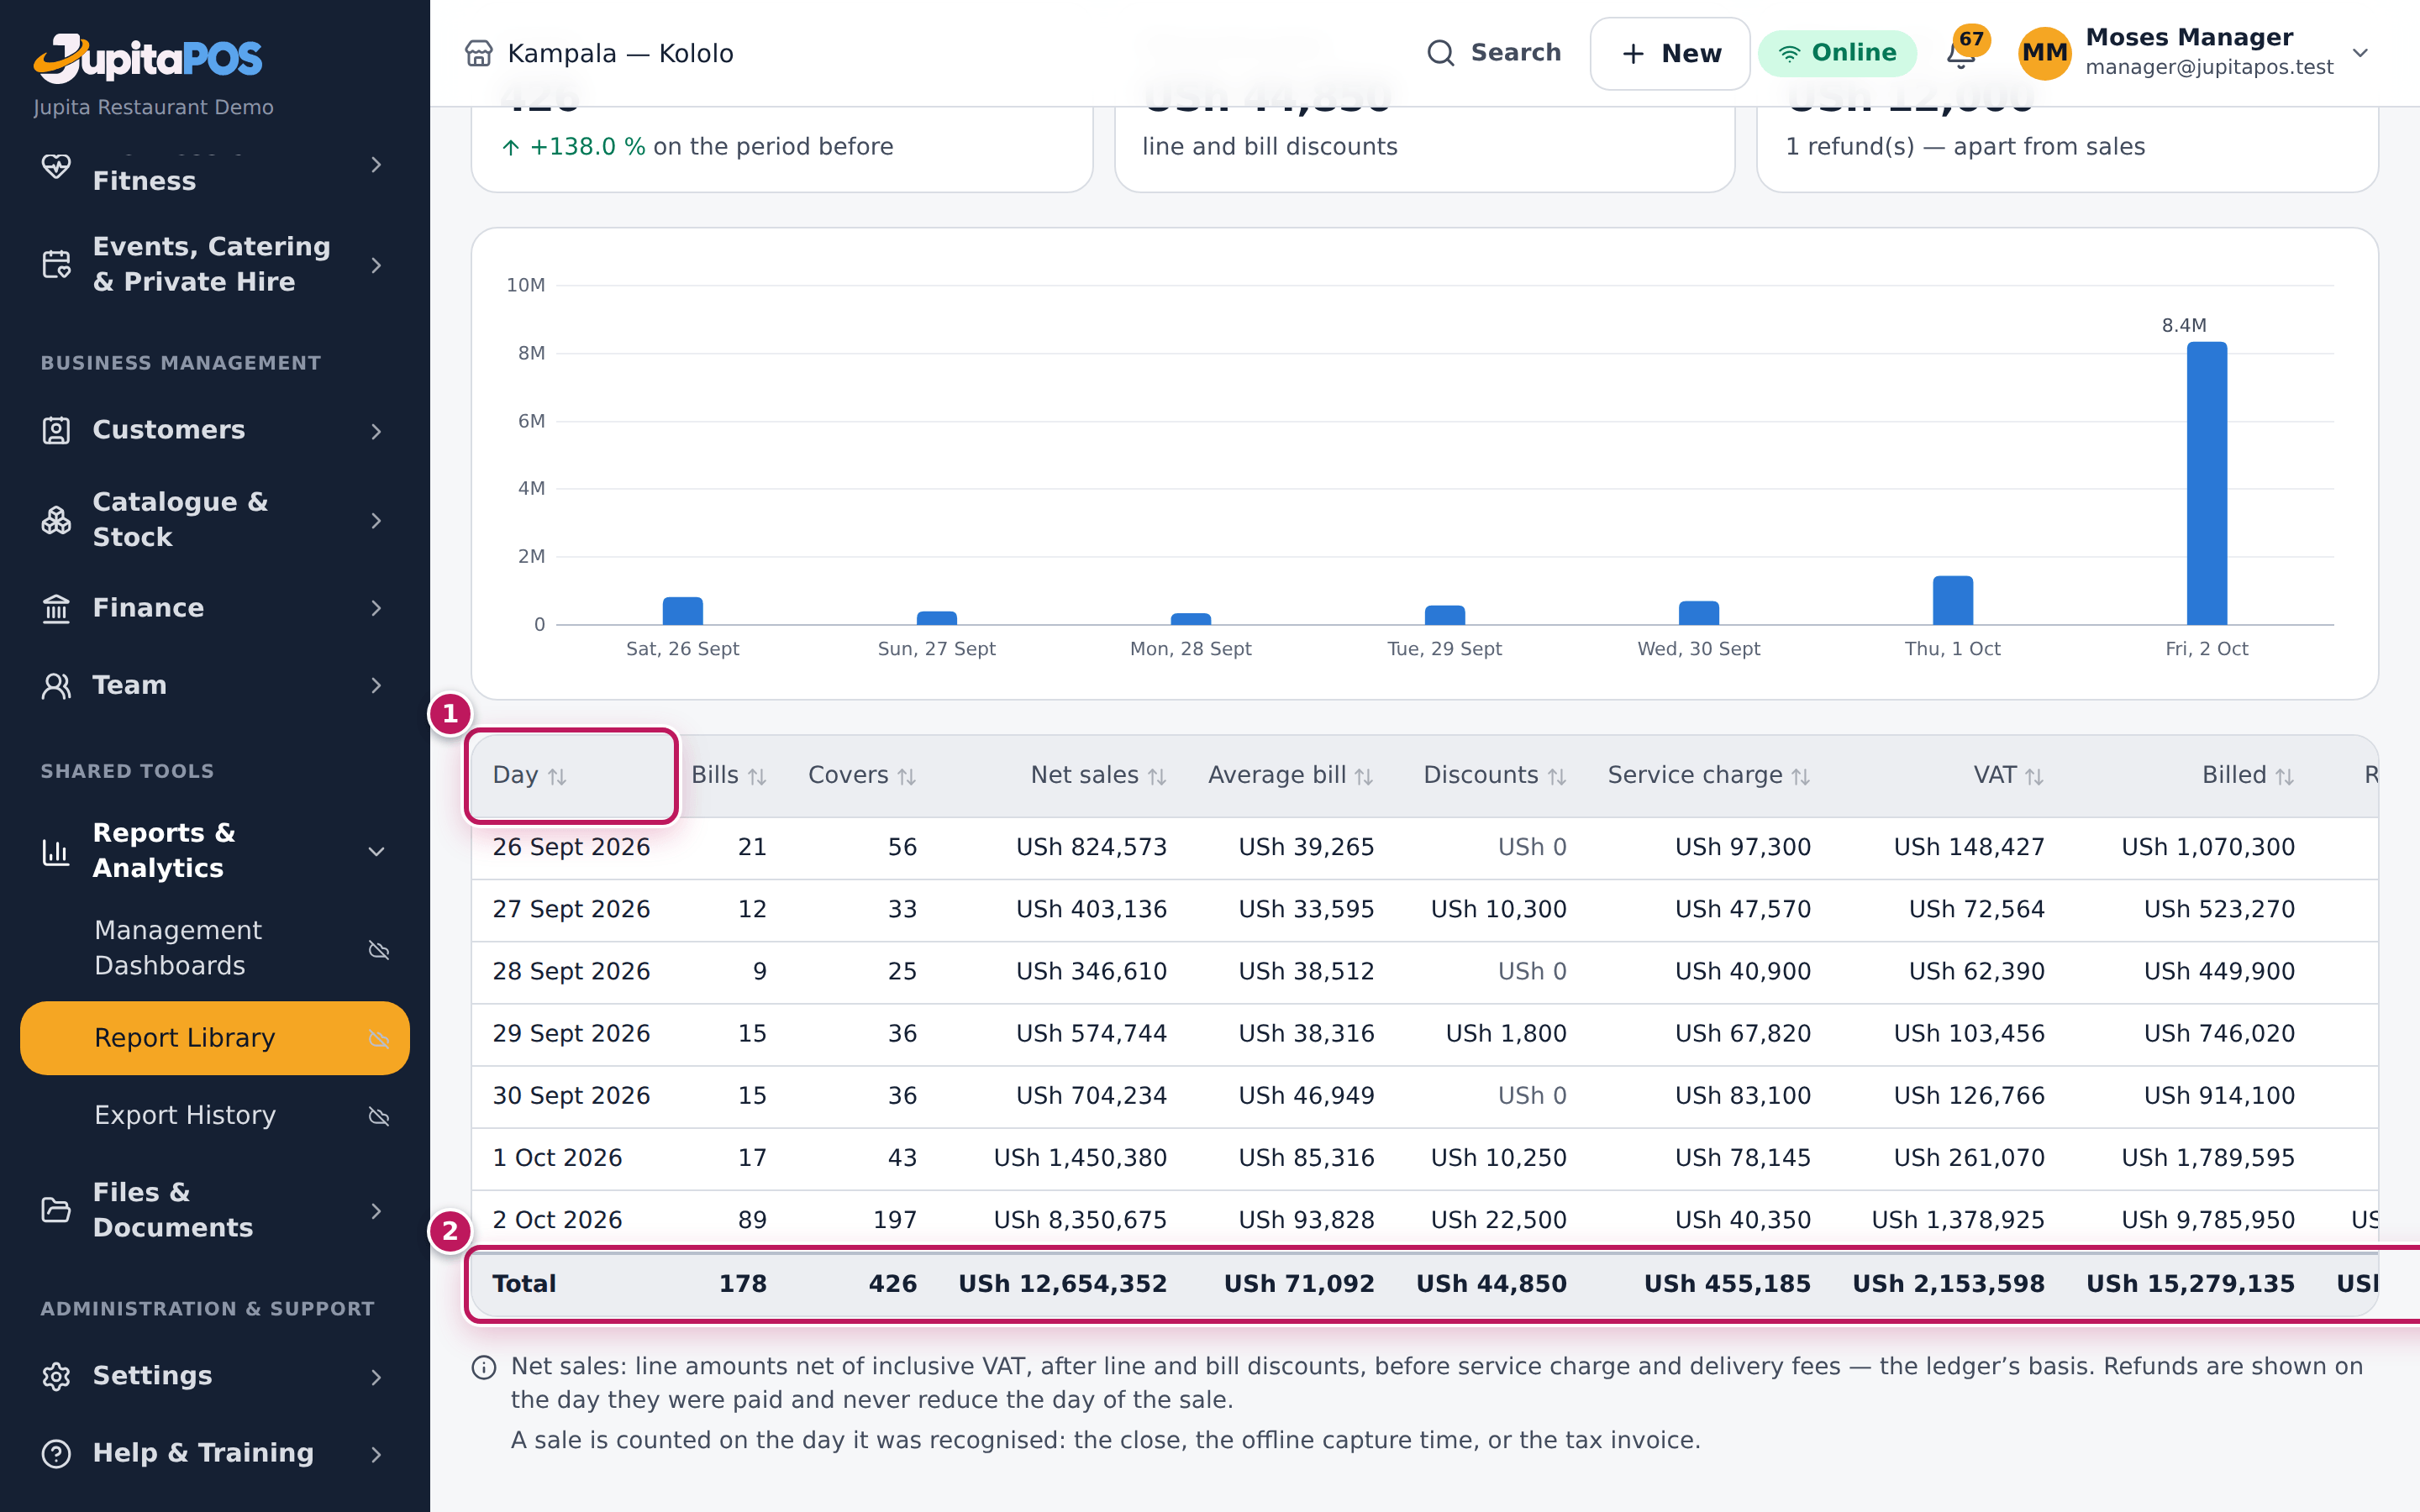
- Read the chart, then the table: click a column (1 in the second picture) to sort it; the totals are at the foot (2). The first 100 rows show; Show all shows the rest.
- Click Export (5) for a file (see Export a report).
Expected result
Sales by day for the last 7 days shows one row a day with bills, covers, net sales, discounts, service charge, VAT, billed and refunds, and the key figures say how each moved on the period before.
Screenshot
Common mistakes
- Choosing a long period and waiting at the page. Periods over about three months are prepared in the background: leave and come back.
- Adding up the columns of a report with a comparison. The extra columns are the period before.
Troubleshooting
- “Differs from the ledger.” It says how much more or less the ledger has than the net sales here. When sales of those days are still to post, wait a minute and click Refresh. When nothing is waiting to post, tell your accountant: compare the sale entries of those days in the general ledger — a sale reversed there, or posted on another day, makes the difference (see Check the posting log).
- “Before the books start.” The days chosen are before the books start: their sales are in the opening balances, so there is nothing to compare.
- “This report cannot be shown as asked”. The period is longer than the report allows, or a filter is missing. Shorten it.
- “The report could not be prepared”. Try Refresh; if it stays, tell your administrator.
Read the day’s sales
Purpose
Know how the day is going hour by hour, and what the figures mean, before the cash-up and the evening service.
Role / permission required
reports.view.
Prerequisites
- None.
Steps
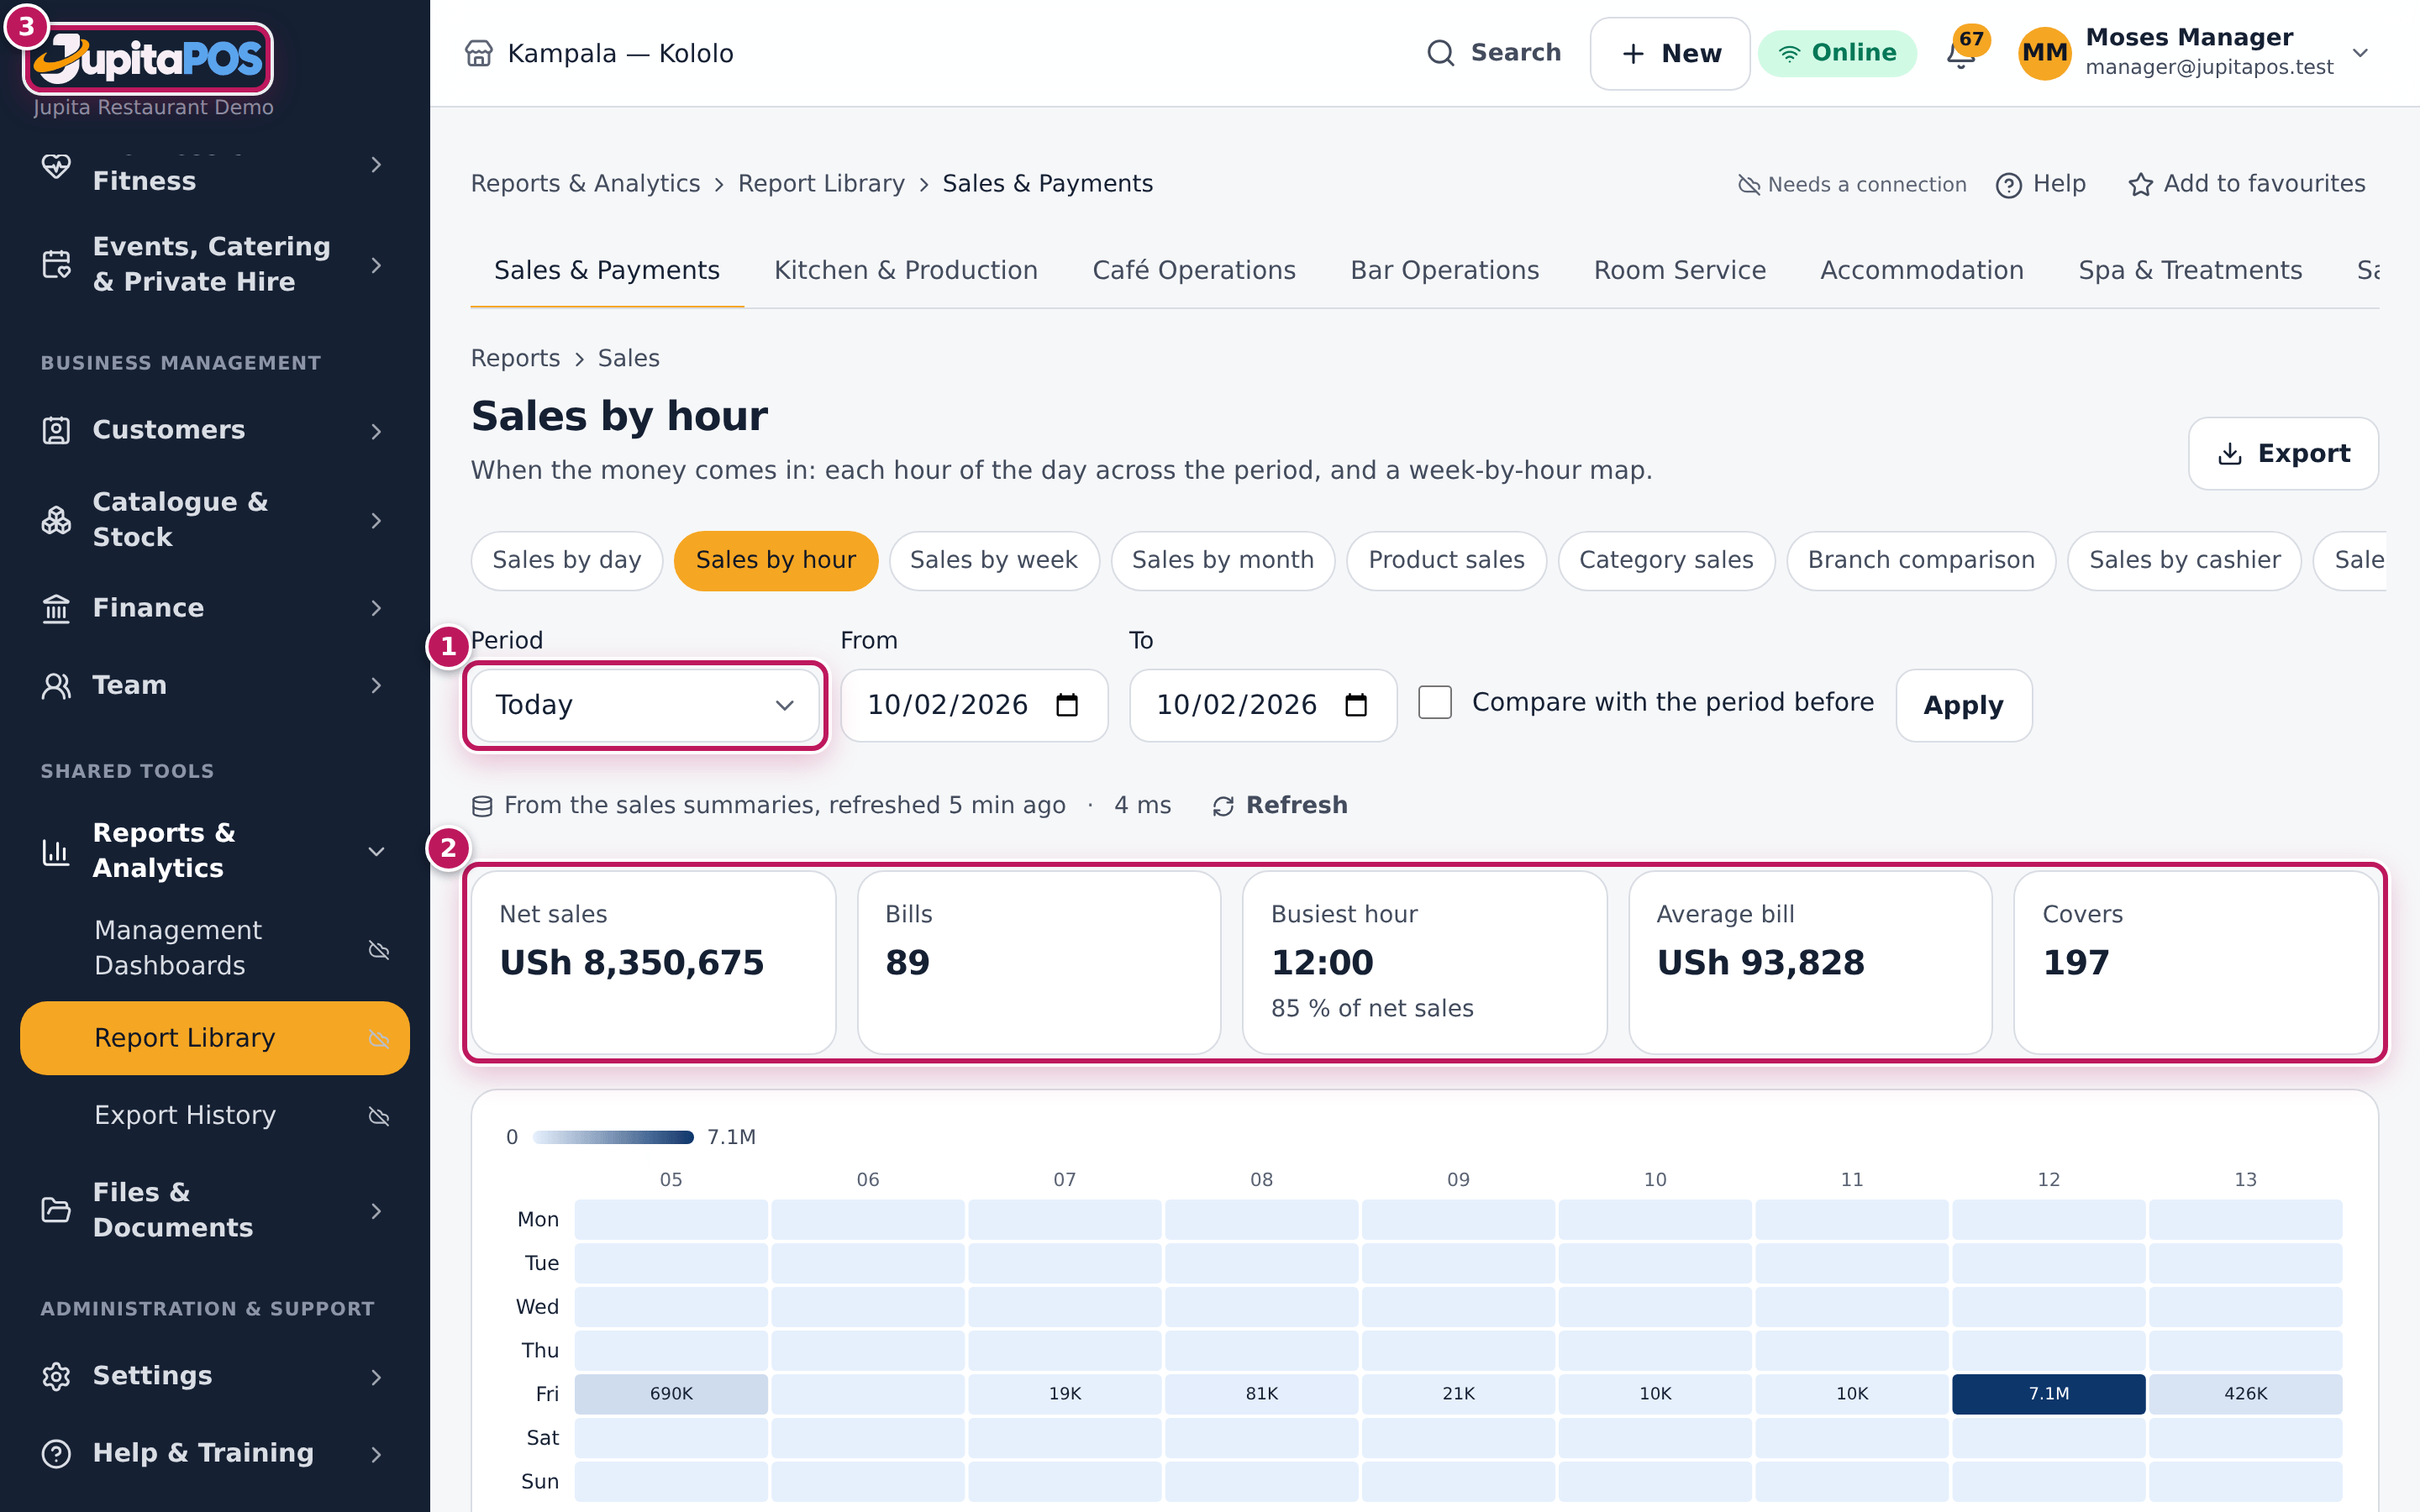
- Open Reports, then Sales, then Sales by hour.
- Set the Period (1) to Today.
- Read the key figures (2): net sales, bills, covers, average bill.
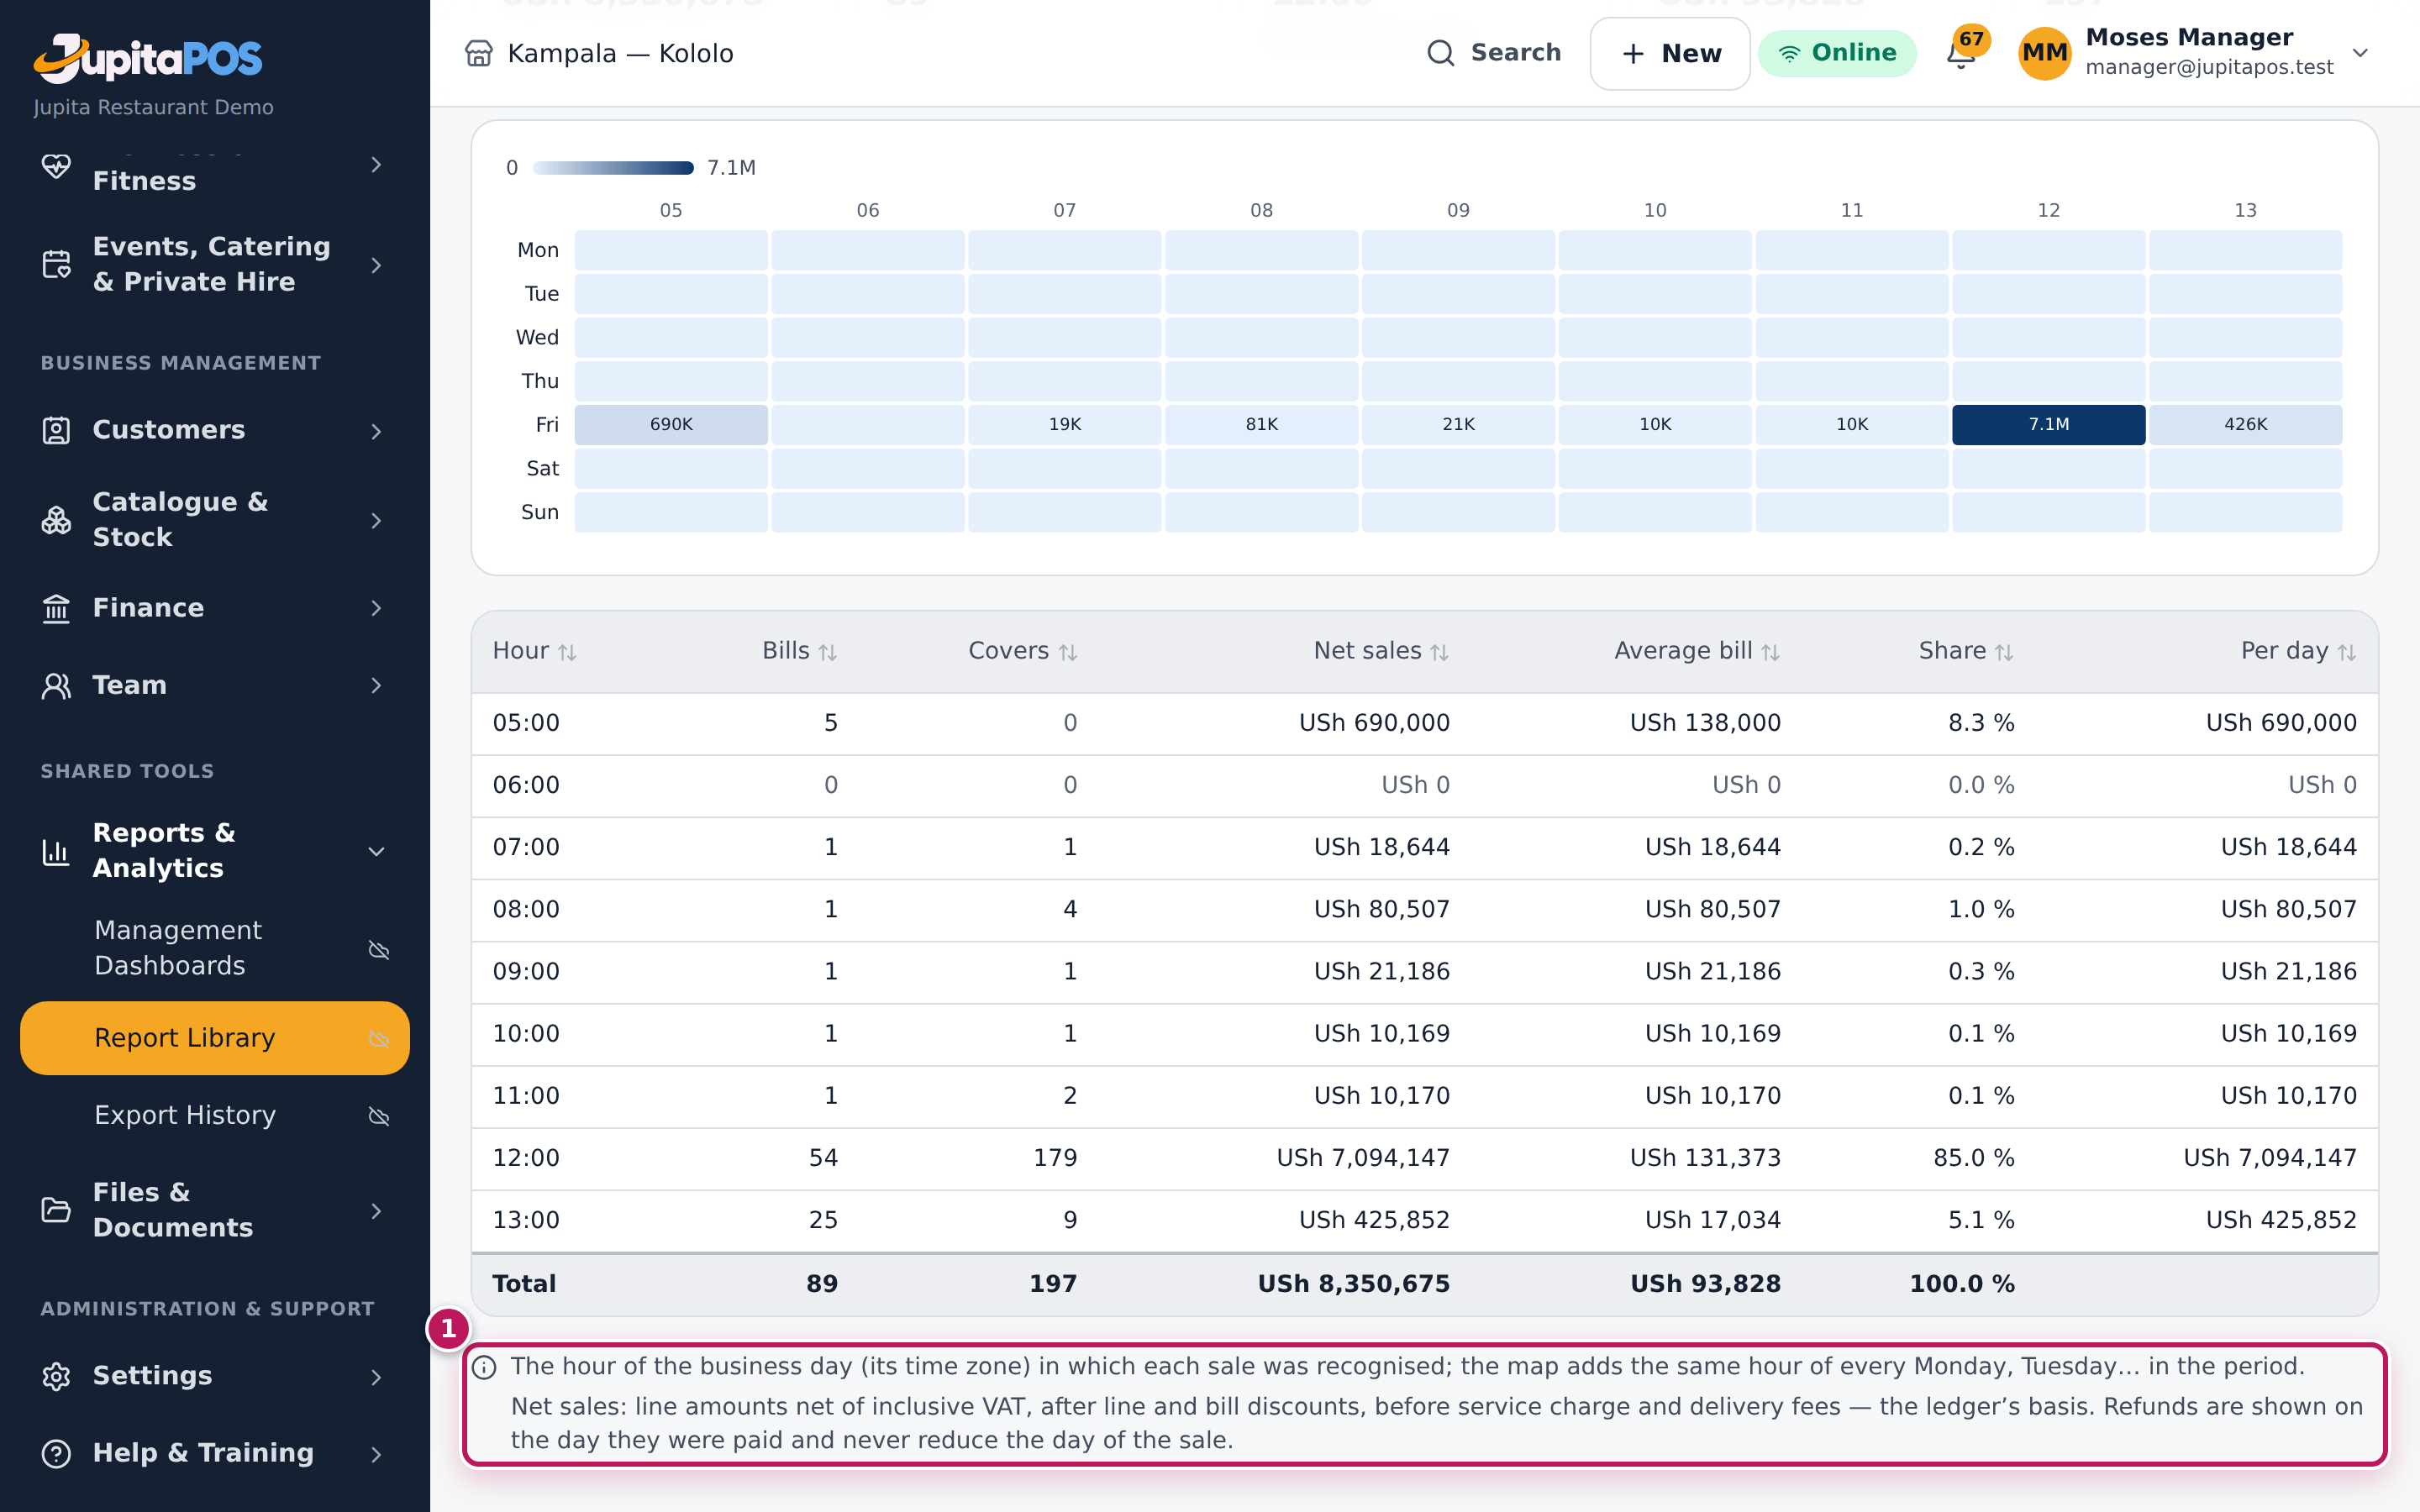
- Read the map (3): each hour of each weekday of the period, darker where more was sold, with the amount in each box. The table under it has every hour with its bills, covers, net sales, average bill and share.
- Scroll to the notes at the foot (1 in the second picture): what each figure means.
Expected result
You see the day’s net sales and when they came in. Net sales means the same everywhere, and the same as the accounts: what the items sold for, net of the VAT included in the price, less discounts, before service charge and delivery fees, on the day the sale was closed. A refund counts on the day it was paid and never changes the day of the sale. Payments taken exclude tips; tips have their own column. Sales reports catch up within about ten seconds of a sale closing (at most a minute).
Screenshot
Common mistakes
- Comparing net sales with the cash in the drawer. The drawer holds cash with VAT and tips, less card and mobile money; use the till’s cash-up for the drawer (see Close the till).
Troubleshooting
- A sale just paid is not there. It appears within a minute; click Refresh (see How fresh the figures are).
Export a report to PDF, Excel or CSV
Purpose
Get a file of a report — to print, to work on in a spreadsheet, or to load into another system.
Role / permission required
reports.export, plus the report’s own permissions. The list of named
guests needs customers.export; cashier and waiter figures need
performance.export.
Prerequisites
- The report shows what you want (see Open a report).
Steps
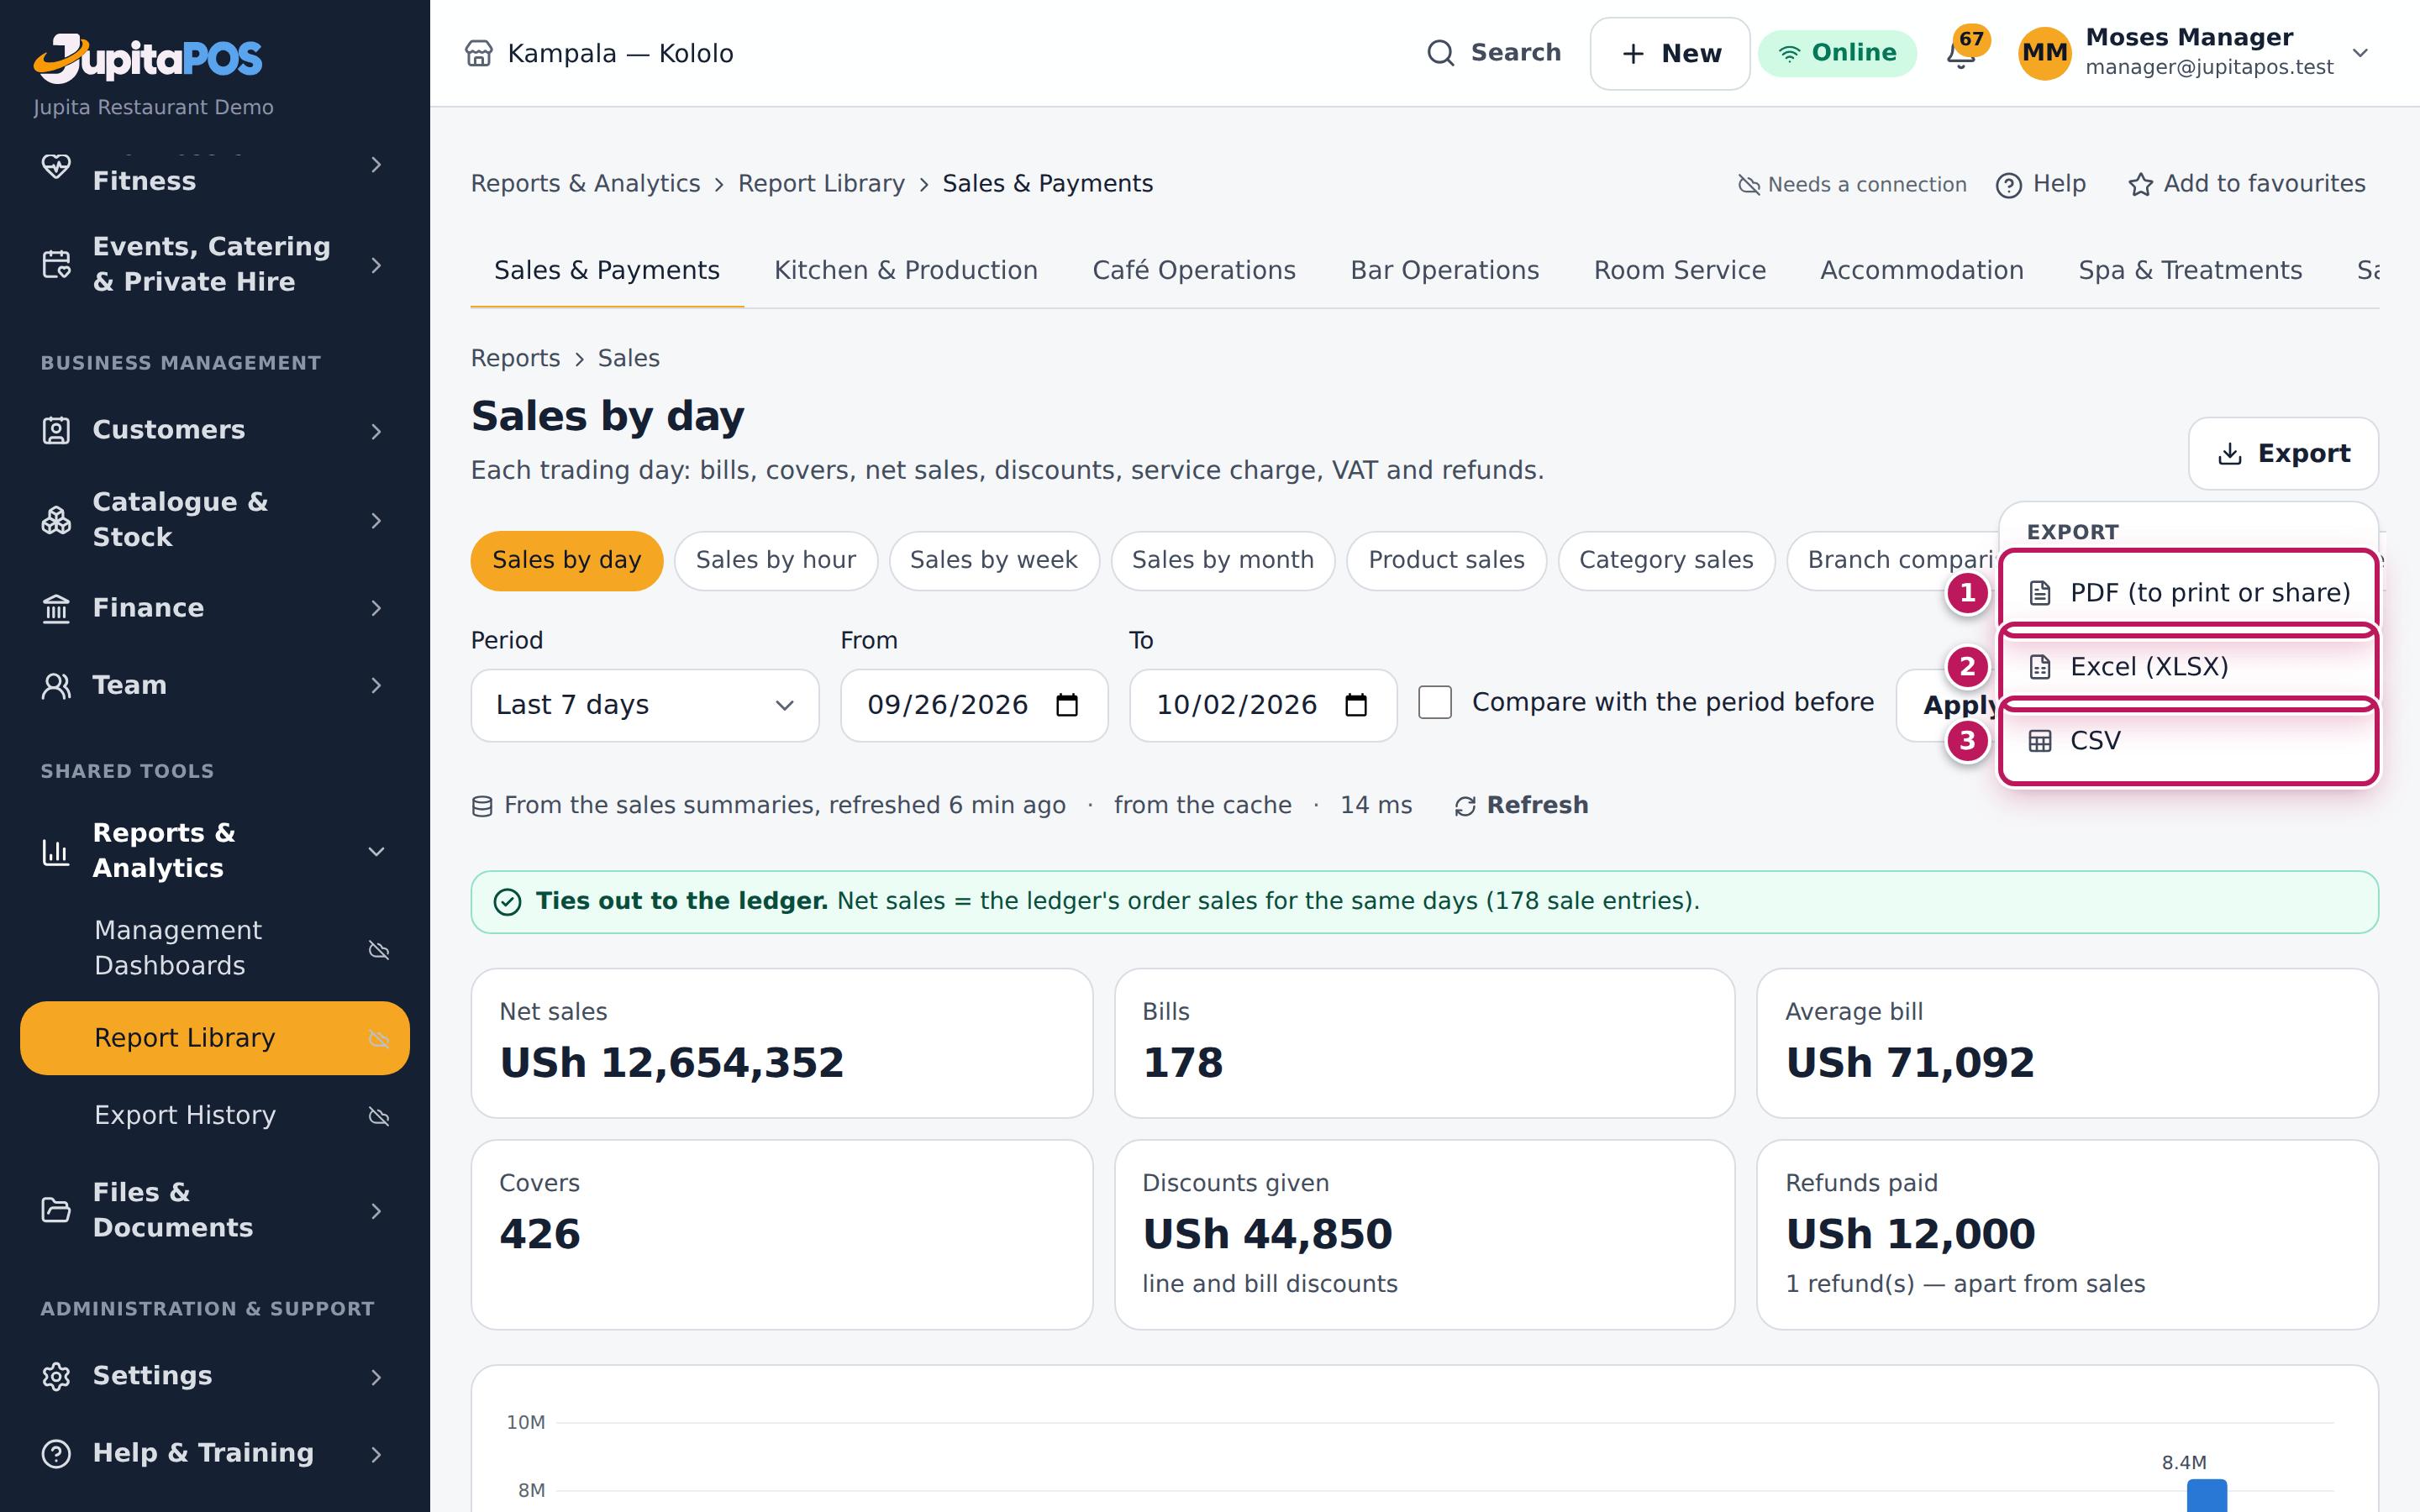
- On the report, click Export.
- Choose PDF (to print or share) (1), Excel (XLSX) (2) or CSV (3).
- A message says Preparing the XLSX: the file is made in the background with exactly the period, branch and filters on screen, and every row.
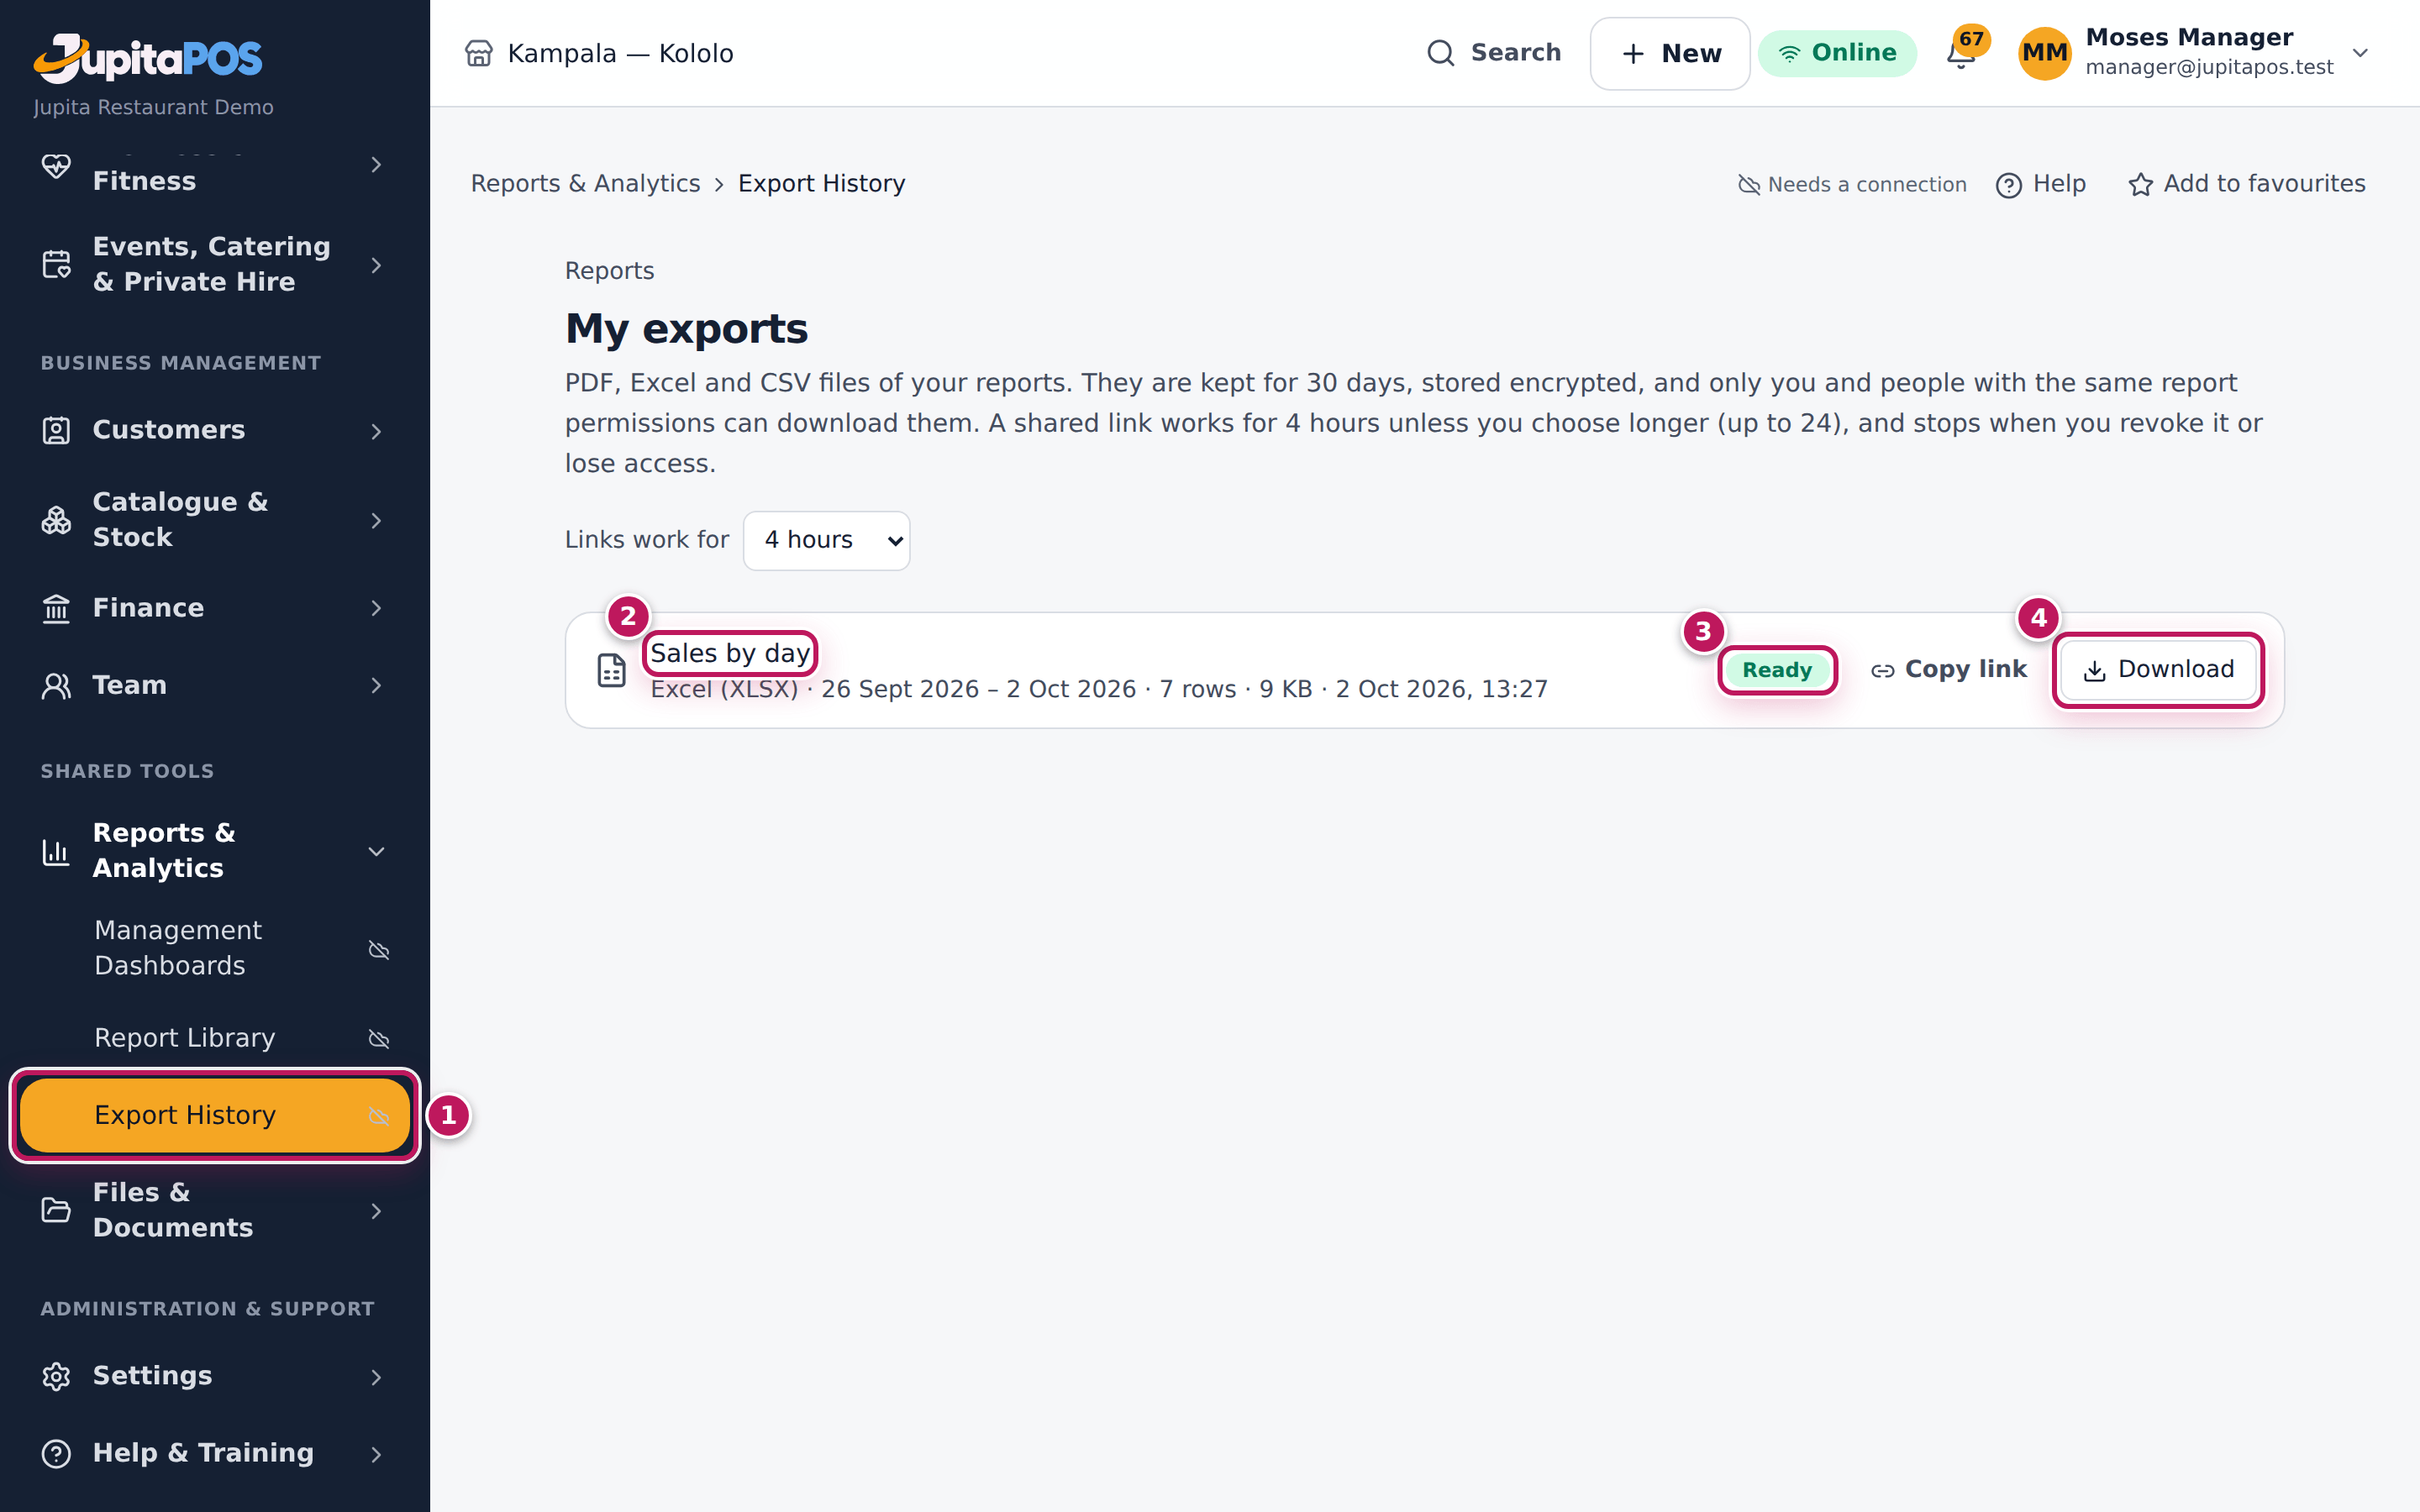
- Open Reports & Analytics › Export History (1 in the second picture) in the menu — the page is My exports — or wait for the notification.
- When the file (2) says Ready (3), click Download (4).
Expected result
The file downloads. A PDF has the business, report, period and filters, the key figures, the checks, the chart and the table with page numbers. An Excel file has real numbers and dates, a frozen header with filters, totals and an About sheet. A CSV is UTF-8, amounts in shillings. Files are kept 30 days; every export and download is in the audit trail.
Screenshot
Common mistakes
- Waiting on the report page for the file. The file is made in the background; carry on and open Export History later.
- Exporting a whole year to CSV for a quick look. Open the report on screen instead; export when you need the file.
Troubleshooting
- The export is refused. You have five files being prepared already, or your role lacks a permission the file needs.
- The file says it failed. The message under it says why; export again.
Share a file with a link
Purpose
Send a report file to someone without a login — your accountant, a partner — safely and for a limited time.
Role / permission required
reports.export.
Prerequisites
- The file is Ready in Export History (see Export a report).
Steps
- Open Reports & Analytics › Export History (My exports).
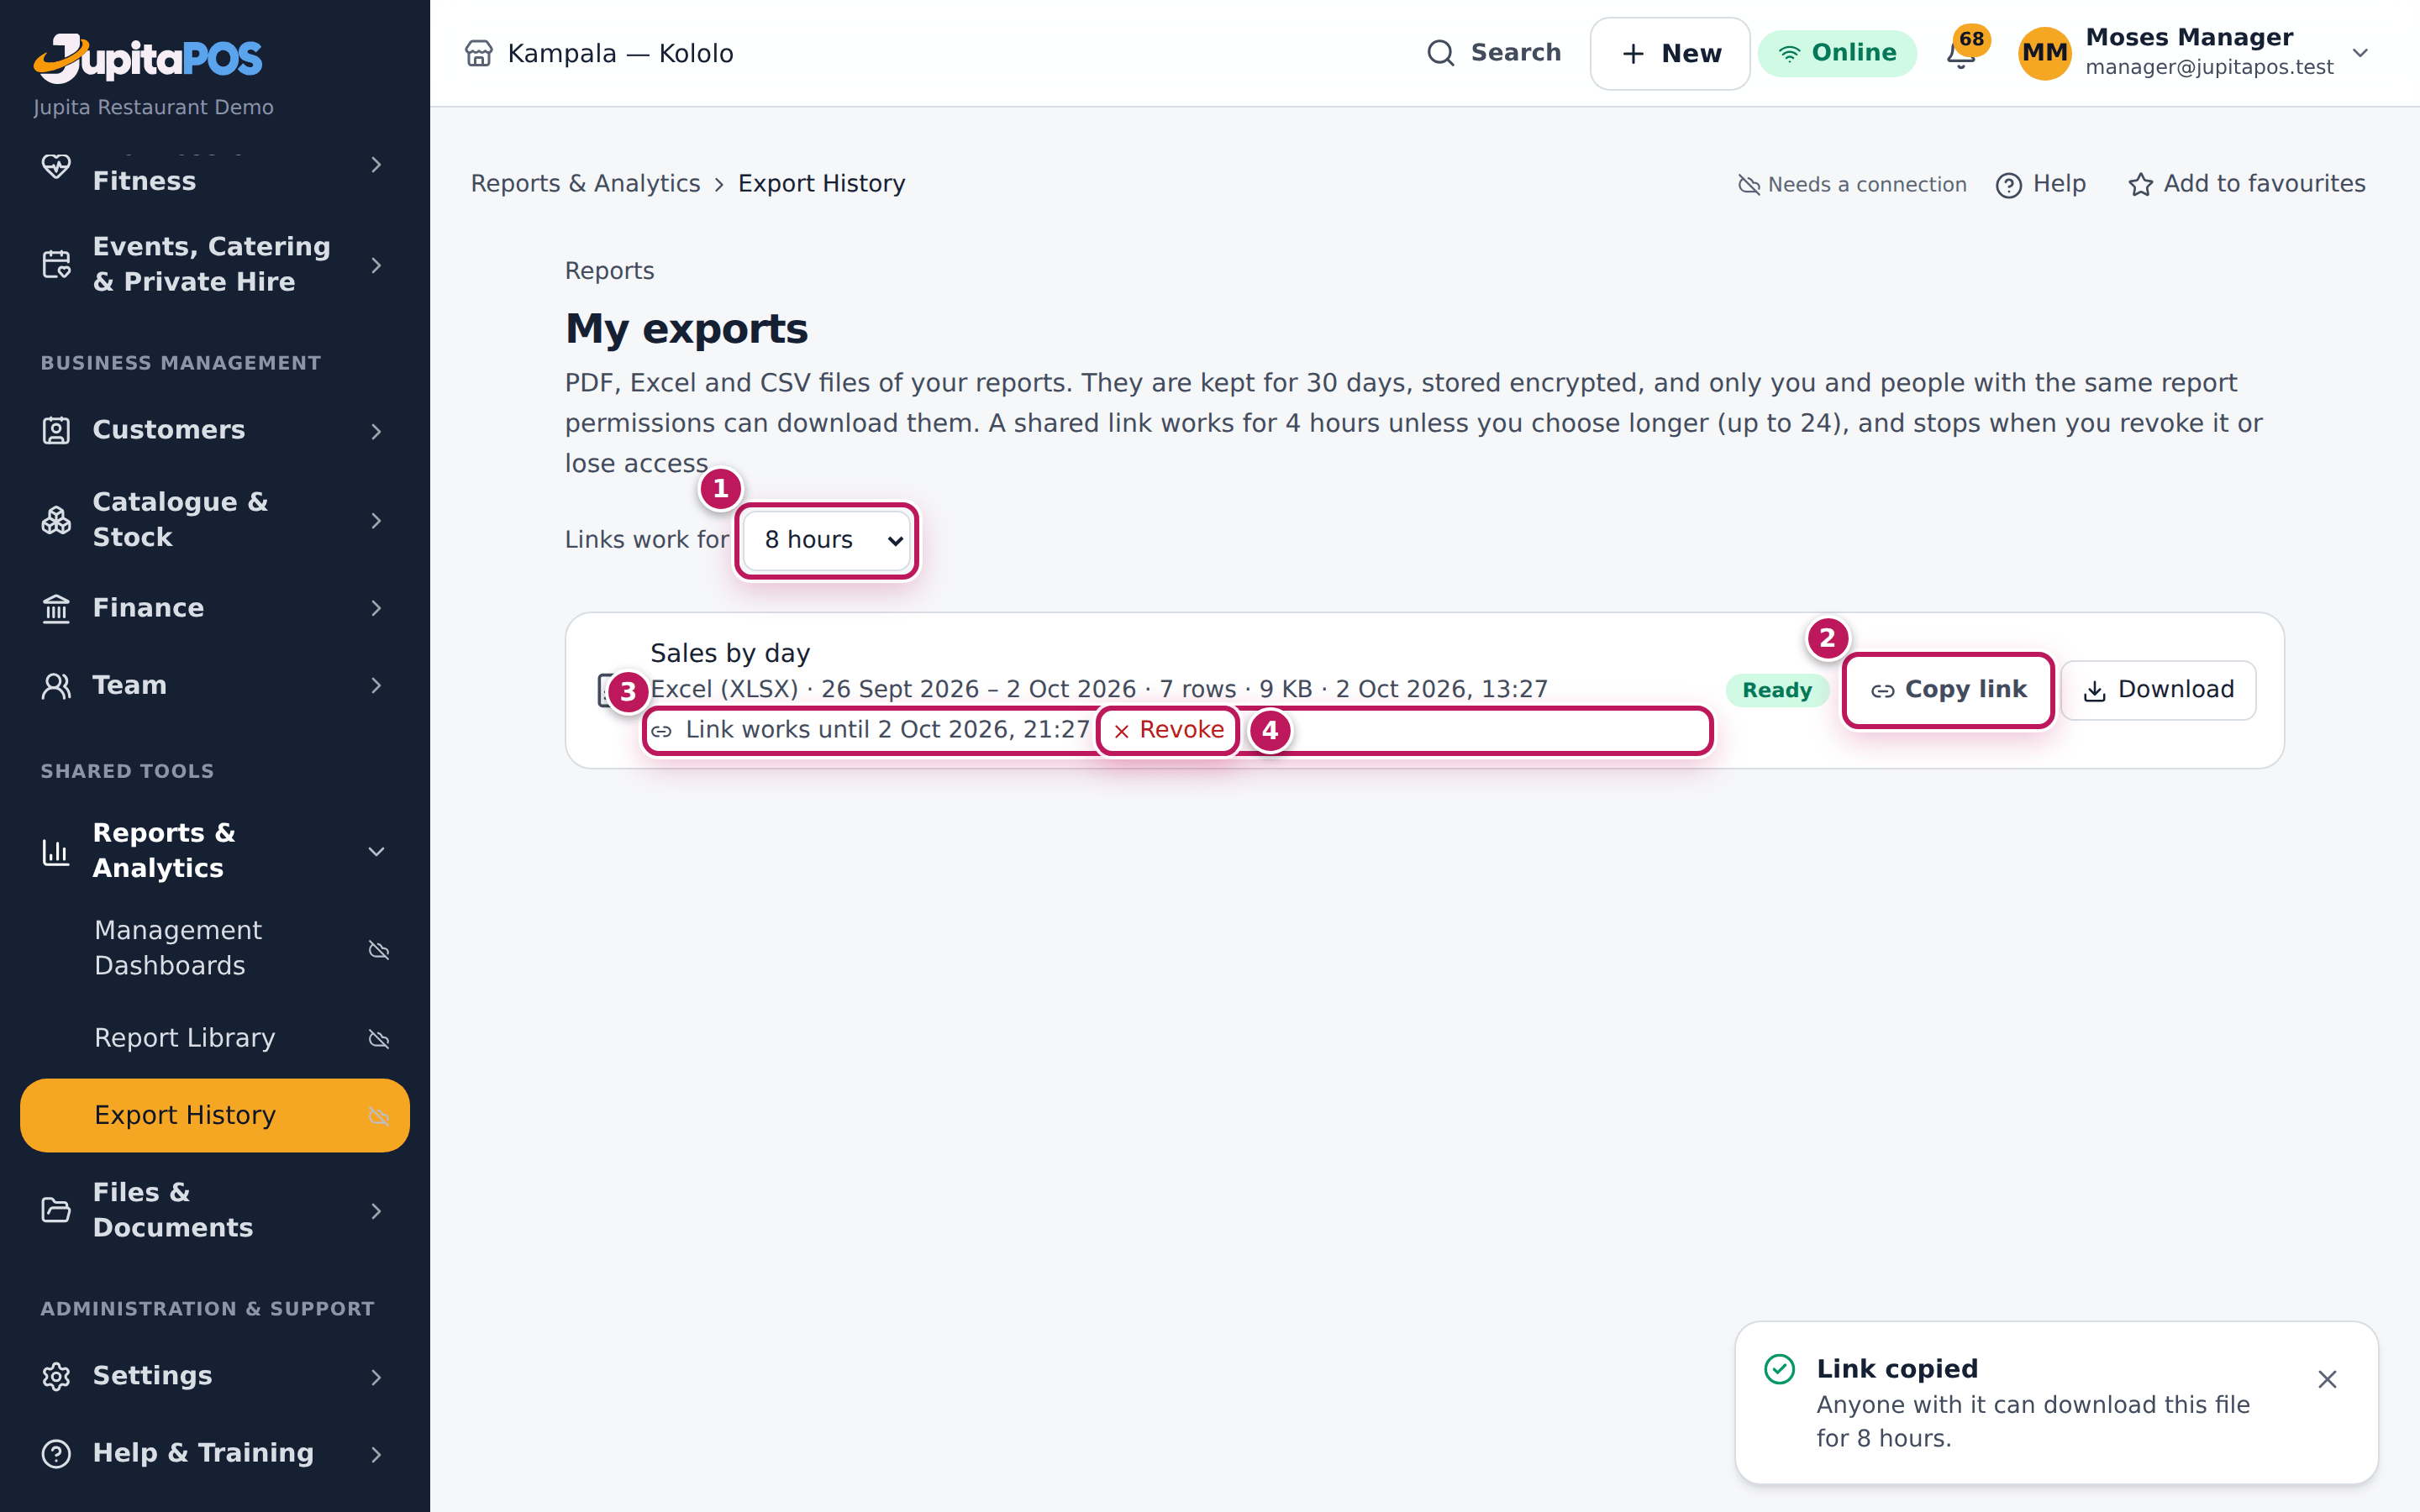
- Choose how long links work in Links work for (1): 4 hours unless you choose more, up to 24.
- Click Copy link (2) on the file. The link is copied: paste it into your message.
- The link is listed under the file (3) with when it stops working and how often it was used.
- To stop it early, click Revoke (4).
Expected result
Link copied — Anyone with it can download this file for 8 hours. Anyone with the link downloads that one file without signing in. After Revoke the message Link revoked — it no longer works appears and the link is refused. A link also stops when its maker is suspended, changes role or loses a permission the file needs. Every link and download is in the audit trail.
Screenshot
Common mistakes
- Sharing a link in a group chat. Anyone with it can download the file until it stops. Send it to one person, for the shortest time.
- Making a link for a file with guests’ names. Keep personal data inside the system.
Troubleshooting
- “Your link” with the address instead of Link copied. The browser did not allow copying; copy the address from the message.
- The link no longer works. It expired, was revoked, or the file was removed after 30 days. Make a new one.
Know how fresh the figures are
Purpose
Trust what you read: know whether a report is up to the minute and bring it up to date when you need to.
Role / permission required
reports.view.
Prerequisites
- None.
Steps
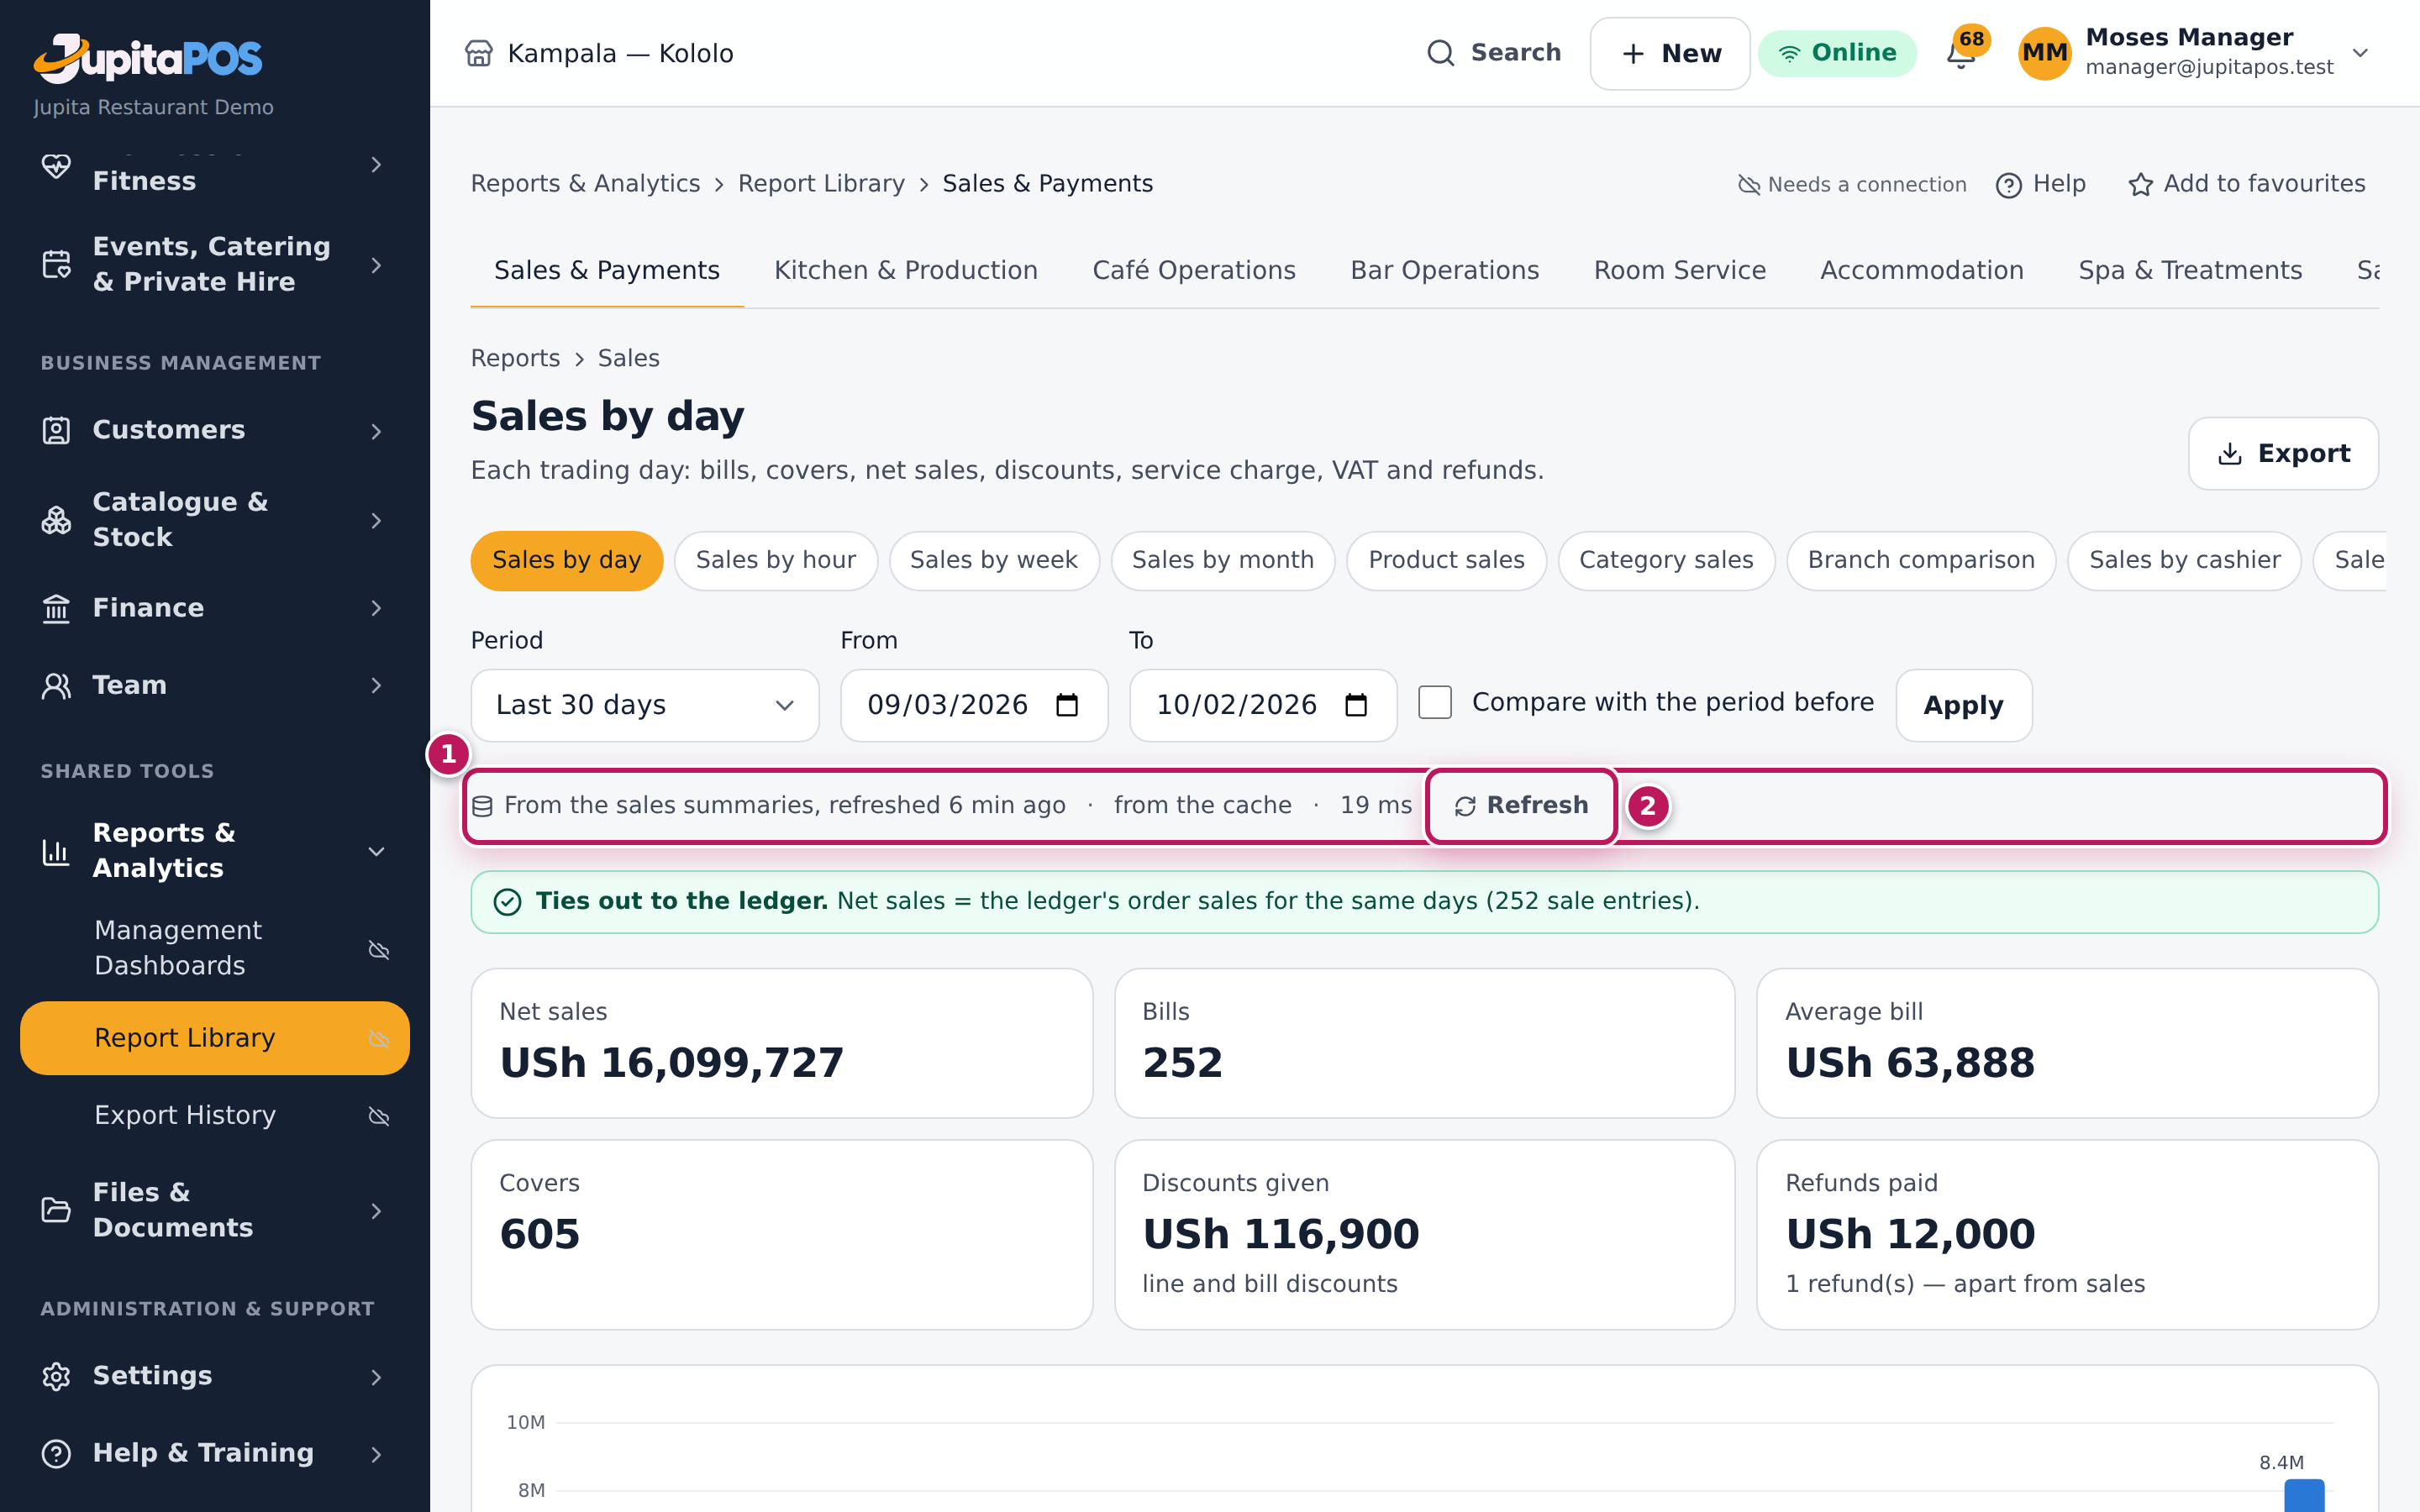
- Read the line under a report’s title (1): From the sales summaries, refreshed … or Live, whether it came from the cache, and how long it took.
- Click Refresh (2) to take in the latest sales and compute it again.
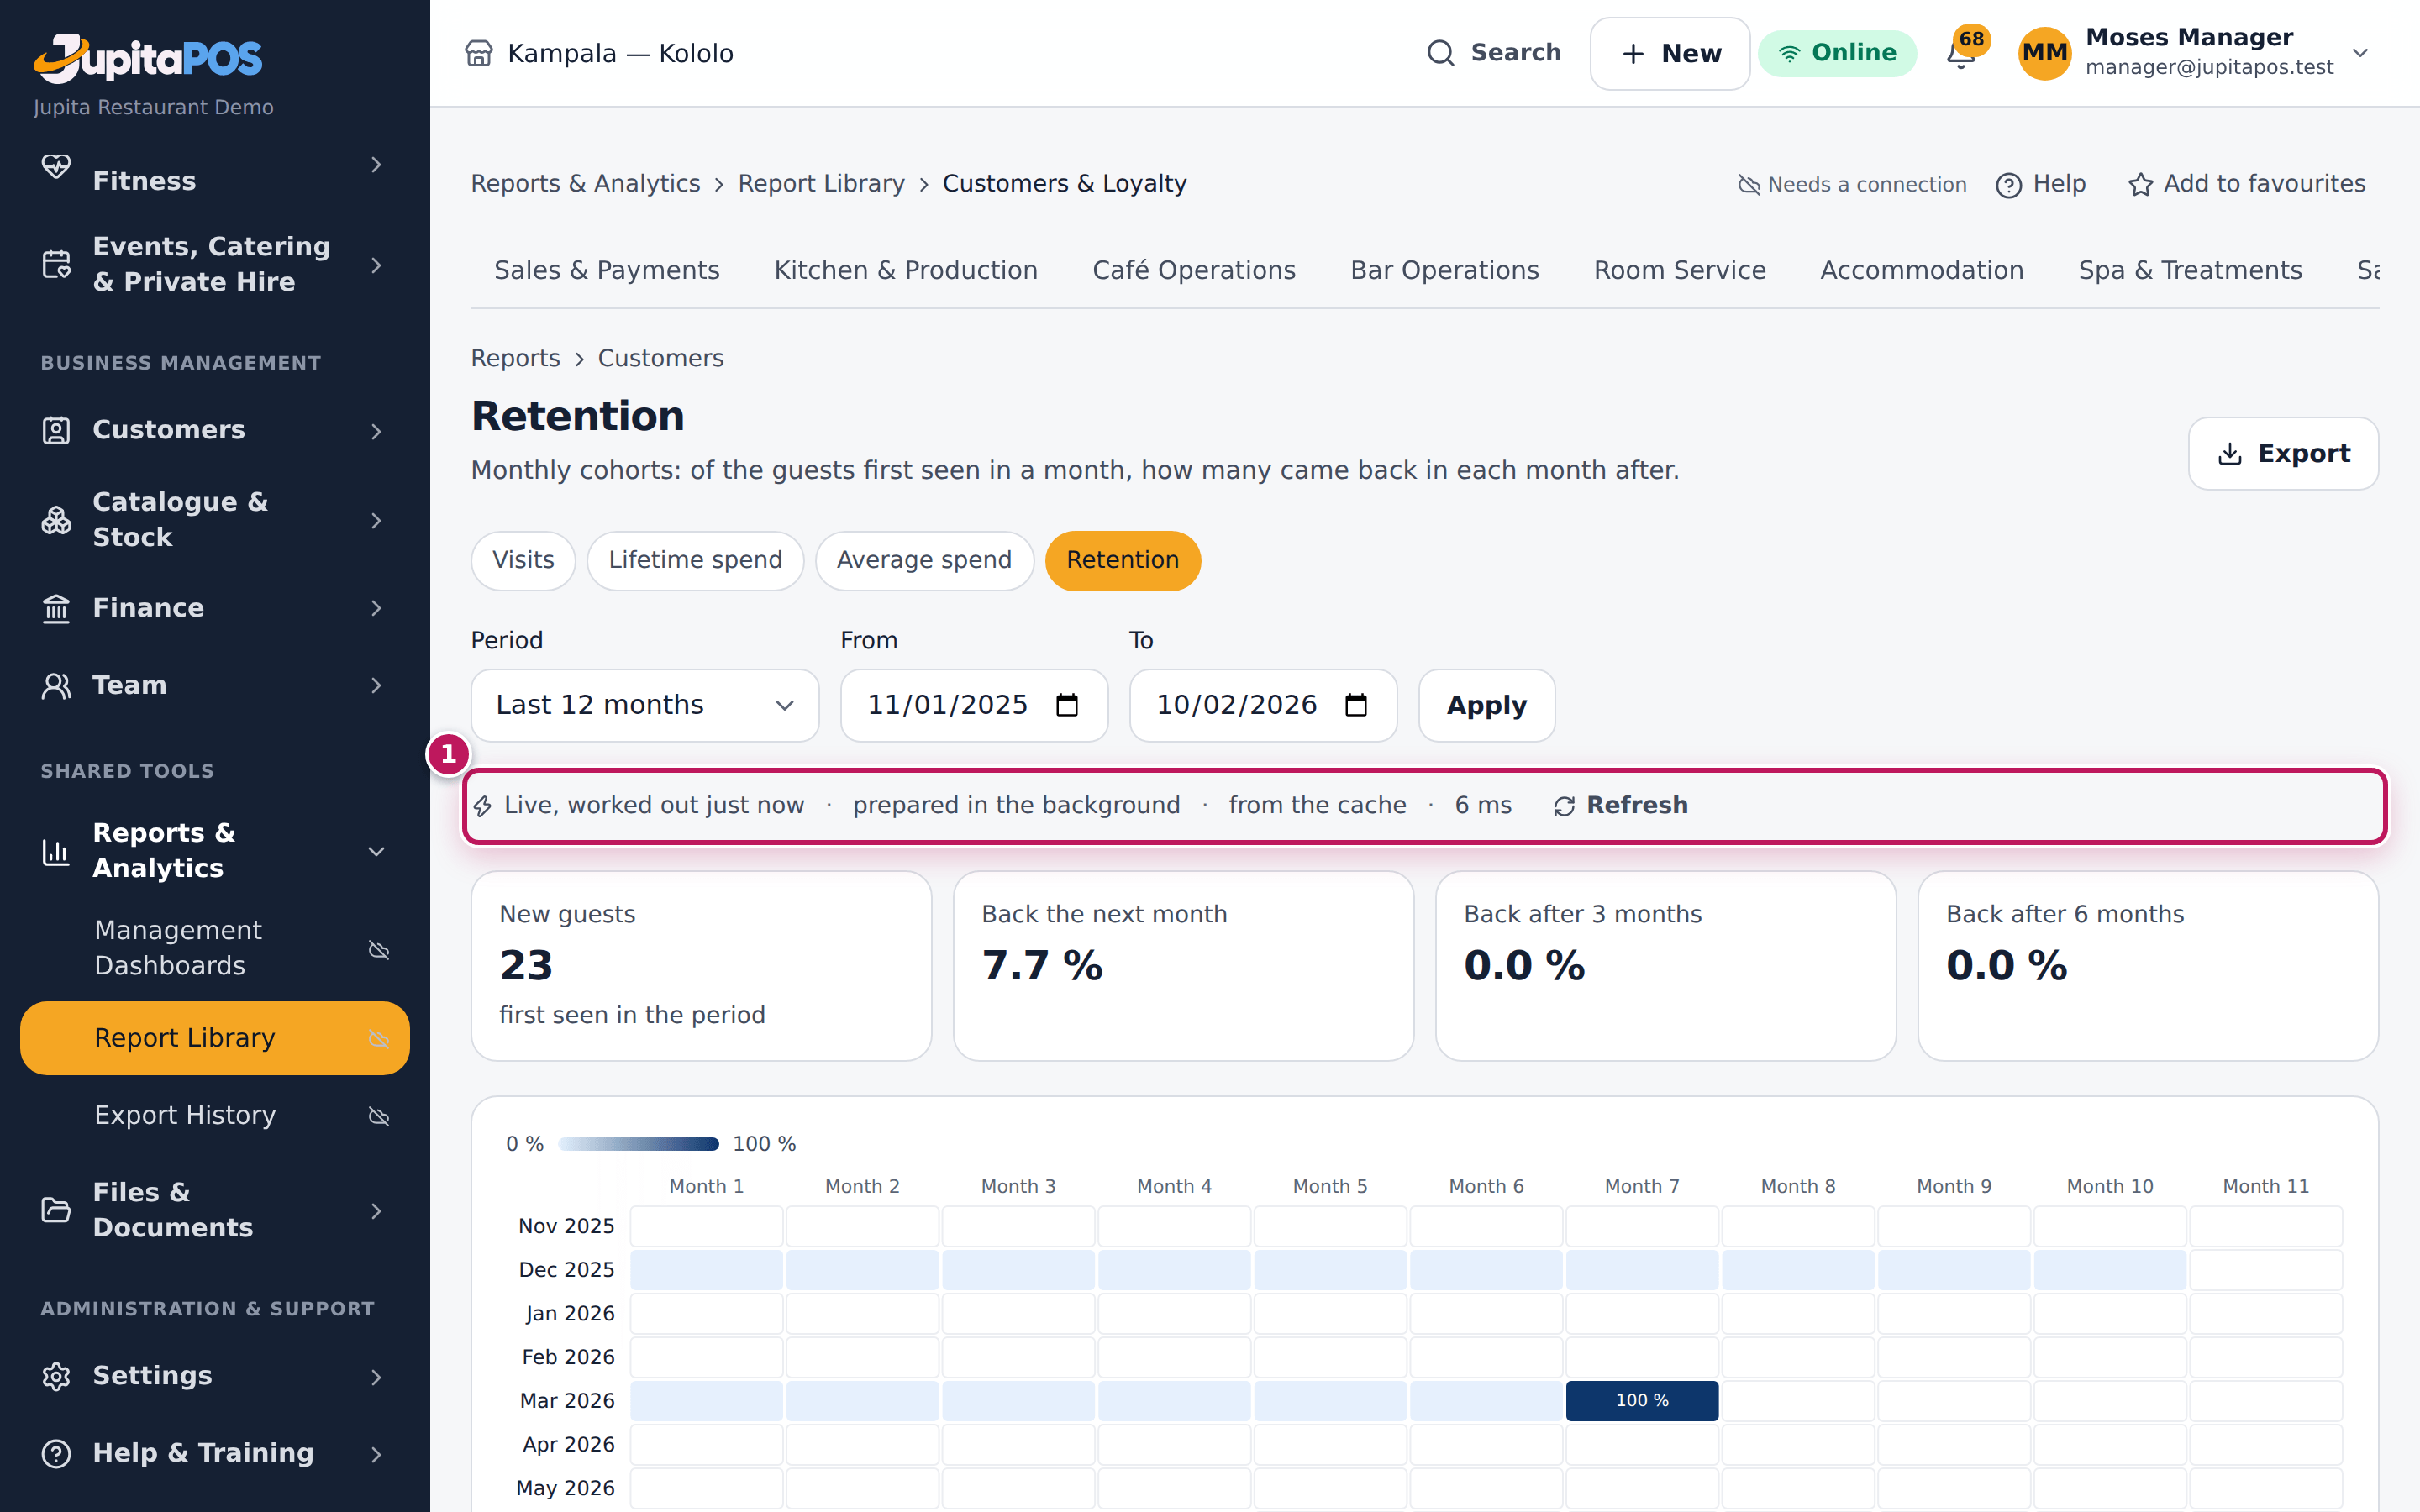
- A long period or a heavy report (retention, purchase trends) says Preparing this report in the background… and fills the page by itself; once ready its line says prepared in the background (1 in the second picture).
Expected result
After Refresh the report shows the sales closed until now. The sales summaries catch up within about ten seconds of a sale closing, and are refreshed every night.
Screenshot
Common mistakes
- Refreshing again and again. Once is enough: the report then includes every closed sale.
Troubleshooting
- The figures stay old after Refresh. The background work may be stopped. Tell your administrator (see Background jobs, in the Help Center inside JupitaPos).