

On this page
Every sale, the moment it is paid and closed, is broken down through its recipe (and its sub-recipes, with the trimming and waste allowances) — or, for a bottle sold as it is, through its link to the stock item — into the ingredients it used. Those quantities are taken out of the store that serves the item’s station (see Which store an outlet uses). Staff meals, events and complimentary items are taken out too, but reported apart. A sale that is reopened or refunded puts its ingredients back (Sales reversed).
Consumption & variance (/inventory/consumption, in the sidebar as
Consumption) compares two figures for each ingredient over a period:
| Column | Meaning |
|---|---|
| Opening · In · Closing | the stock at the start, what came in (deliveries, transfers in, returns), the stock at the end |
| Theoretical | what the recipes say the sales used |
| Actual | what really left: opening + in − transfers out − returns − issues − closing |
| Variance | actual − theoretical |
| Explained | what the ledger already explains: waste, damage, expiry, write-offs, count shortfalls, adjustments |
| unexplained | what the ledger cannot explain — theft, over-portioning, a recipe that is wrong, a delivery not received |
| Cost variance | the variance at the average cost |
A positive variance means more left the store than the recipes can account for. When it is all explained, you know where it went; the red unexplained figure is the one to chase.
Who can read it
Anyone with inventory.view opens the page — storekeepers, chefs,
supervisors, managers. The money — the totals line, Cost variance and
the values in Where did it go? — shows only to people with menu.costs
or inventory.manage; a storekeeper sees the quantities only.
See what sales used
Purpose
See, for a day, a week or a month, how much of each ingredient the sales should have used and how much really went — the first look at food and drink cost control.
Role / permission required
Chef, manager, storekeeper — anyone with inventory.view; the money
figures are for those with menu.costs or inventory.manage.
Prerequisites
- The dishes sold have recipes (see Write a recipe for a menu item).
Steps
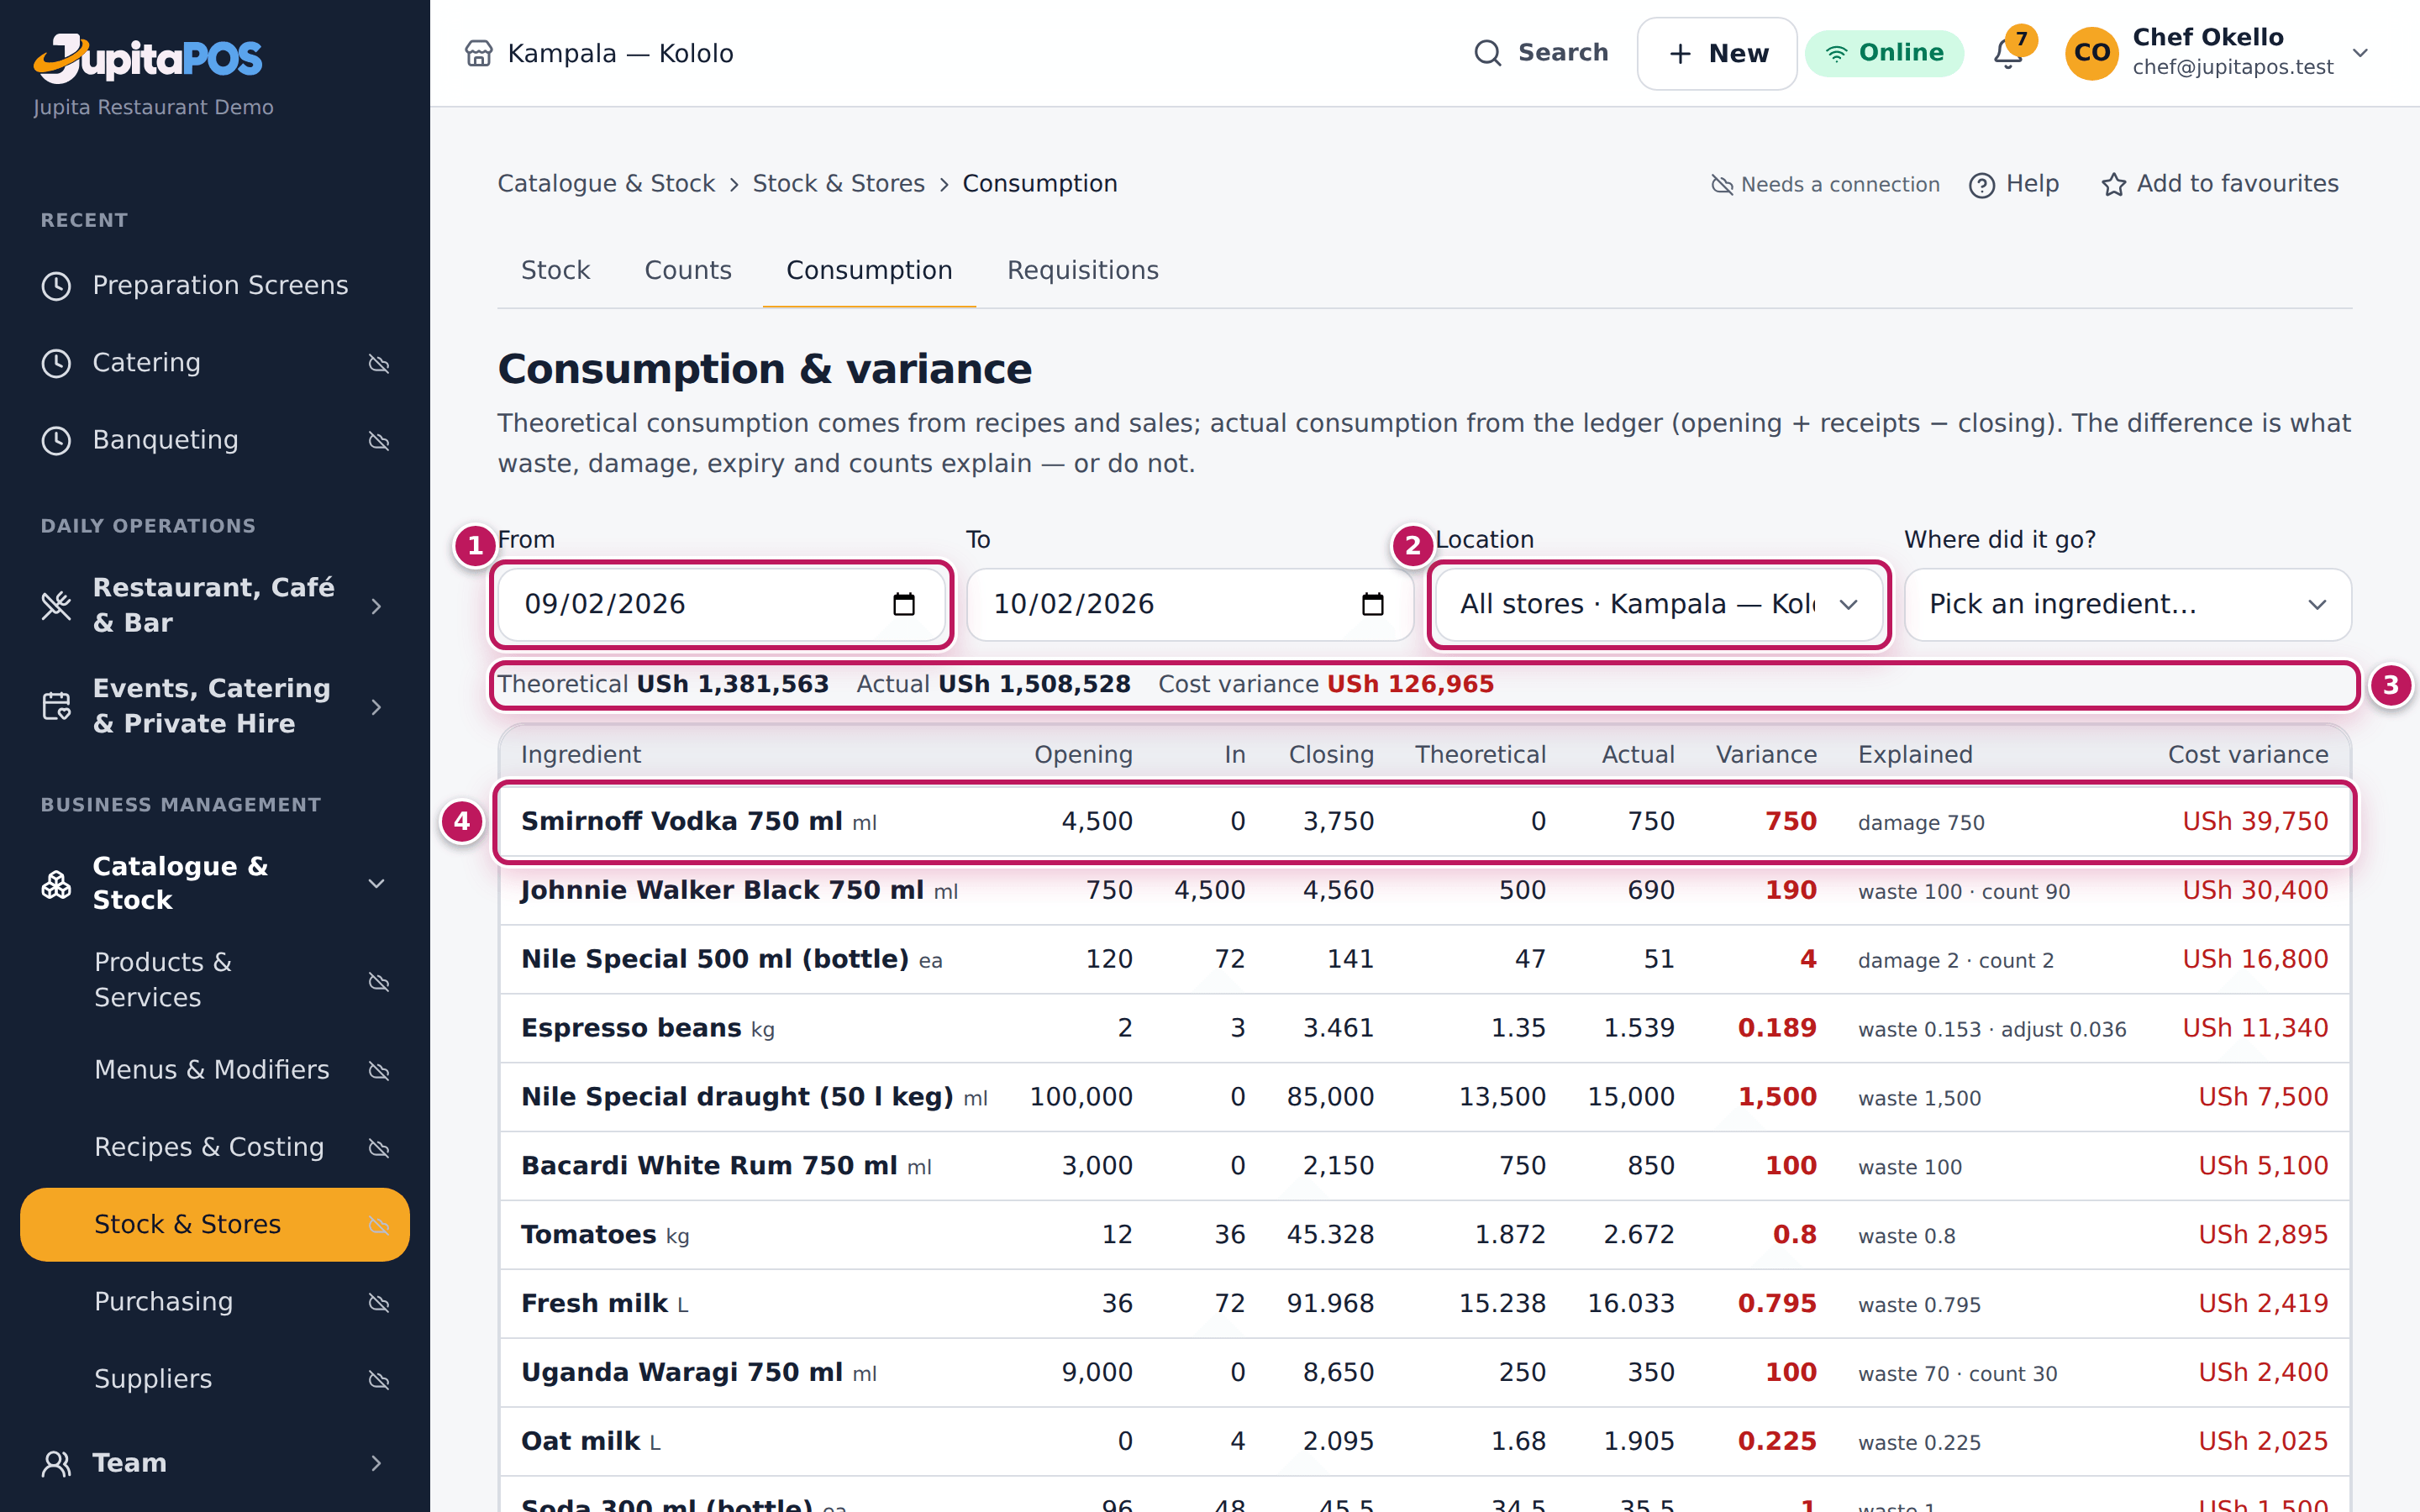
- Open Consumption from the sidebar. The page opens on the last 30 days for every store of your branch.
- Set the period with From (1) and To. For one day, choose the same date twice.
- Leave Location (2) on All stores · Kampala — Kololo, or choose one store.
- Read the totals line (3): Theoretical, Actual and Cost variance in shillings.
- Read the table (4), one row per ingredient, the biggest cost variance first.
Expected result
For Kampala — Kololo the totals show what the recipes say the sales used and what really left, each in shillings, and the cost variance between them. Each row gives the ingredient with its unit, the quantities in and out, and what explains its variance — for example damage 2 · count 2 for the Nile Special bottles. Ingredients whose sales match their stock show 0 and USh 0.
Screenshot
Common mistakes
- Reading a period with deliveries still to receive. A delivery that came but was not received makes the actual look too small; receive it first.
- Judging theoretical use for a dish with no recipe. A dish without an active recipe uses nothing in theory. Give it a recipe.
Troubleshooting
- The page says “Computing variance” for a long time. A long period over many stores takes a moment. Choose one store or a shorter period.
- “No stock in scope”. The chosen store holds nothing in the period.
Compare theoretical and actual use
Purpose
Find out where stock is lost — by ingredient and by store — and whether the loss is explained (waste, breakage, counts) or not, so you can act: train, fix a recipe, lock a store.
Role / permission required
Manager, chef or store manager (inventory.view, with menu.costs for the
money).
Prerequisites
- The store was counted at the end of the period, so its closing stock is true (see Count stock).
Steps
- Open Consumption and set the period.
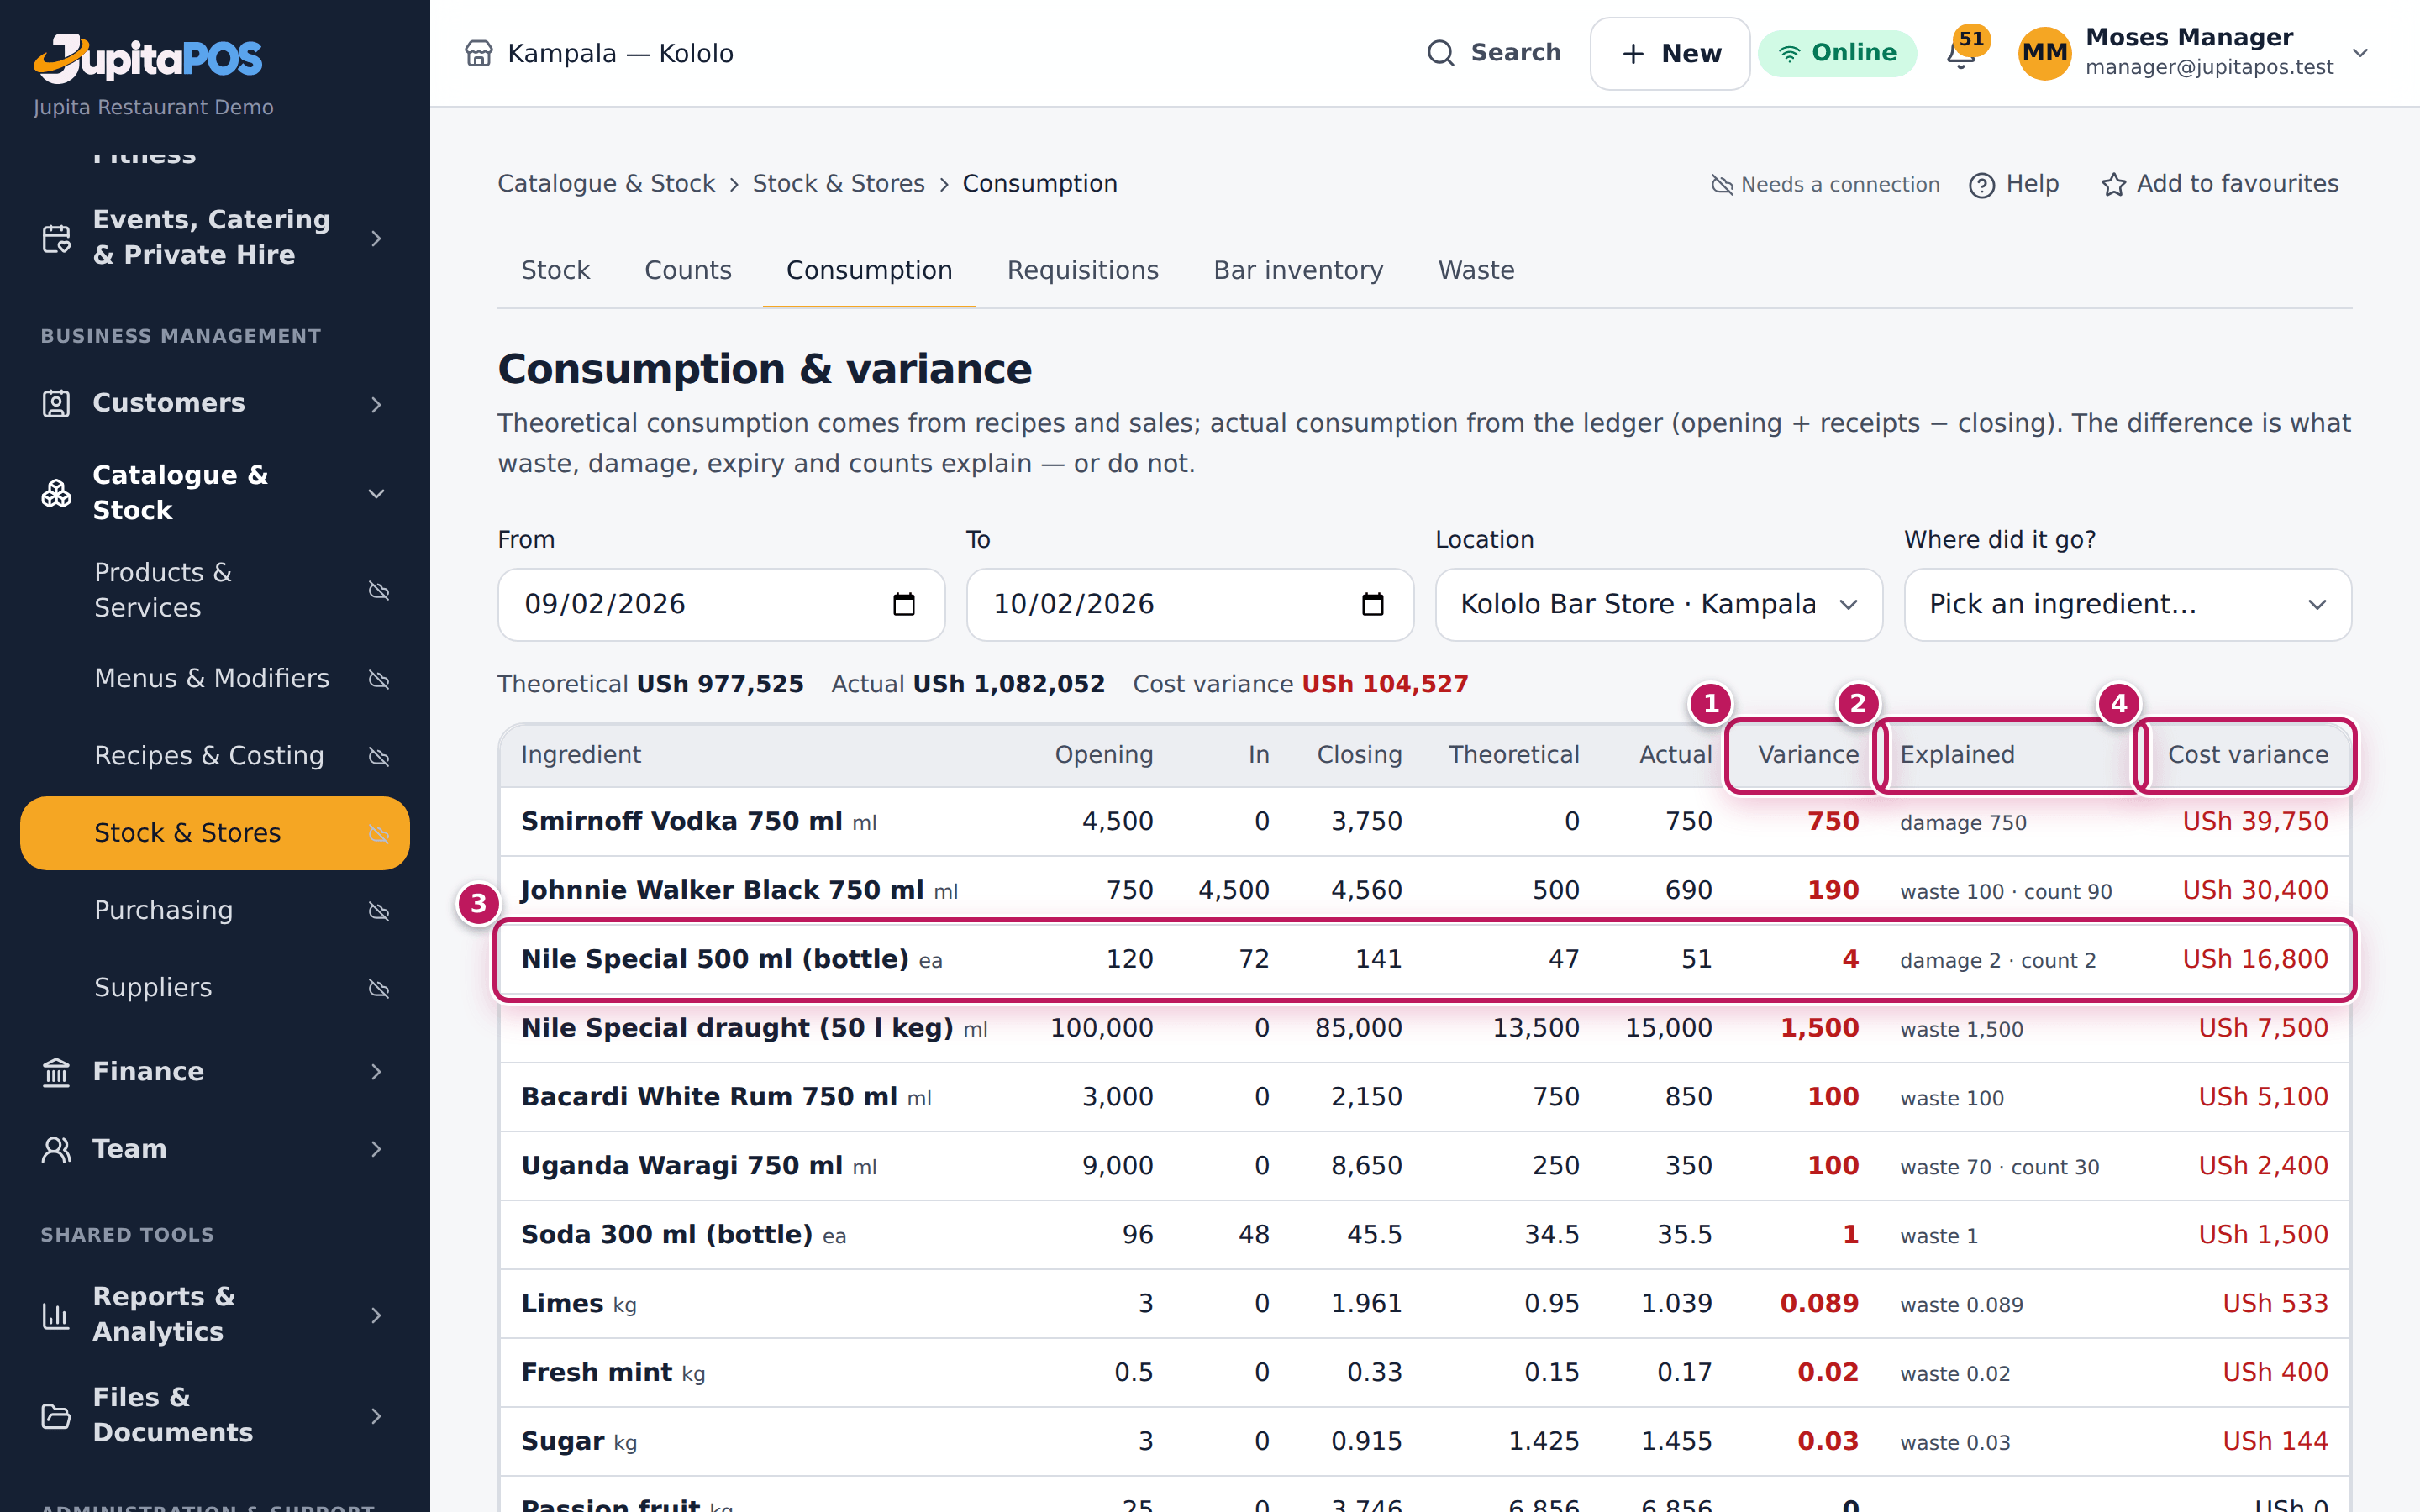
- Choose one store in Location, here Kololo Bar Store.
- Read Variance (1): how much more (red) or less (green) left than the sales explain.
- Read Explained (2): the ledger’s own explanations, and an unexplained figure in red if there is one.
- Follow the biggest rows (3) first: the Cost variance (4) tells you where the money is.
- Tap an ingredient’s name to see where it went (see Follow one ingredient).
Expected result
At Kololo Bar Store the Nile Special row reads: 4 bottles more left the store than the sales explain — variance 4 — explained by damage 2 · count 2 (two bottles broken, two found missing at the evening count), cost variance USh 16,800. Nothing is unexplained, so the bar knows where every bottle went.
Screenshot
Common mistakes
- Treating explained variance as fine. Waste and breakage are explained, but they are still money. Look at the biggest explained rows too.
- Chasing a variance on an ingredient the store does not count. Without a count, the closing stock is only what the books say; count before you judge.
Troubleshooting
- A big unexplained figure on one ingredient. Check, in this order: a delivery not received, a recipe quantity that is wrong, stock moved without a transfer, over-portioning. Count the store to confirm.
- No Cost variance column and no totals line. You do not have
menu.costsorinventory.manage; the quantities are the same.
Follow one ingredient
Purpose
Answer “where did the sugar go?” for a period: every dish that used it, every loss, every move — biggest first — and what is left in each store.
Role / permission required
Chef, manager or storekeeper (inventory.view).
Prerequisites
- None.
Steps
- Open Consumption and set the period and, if you want, one store.
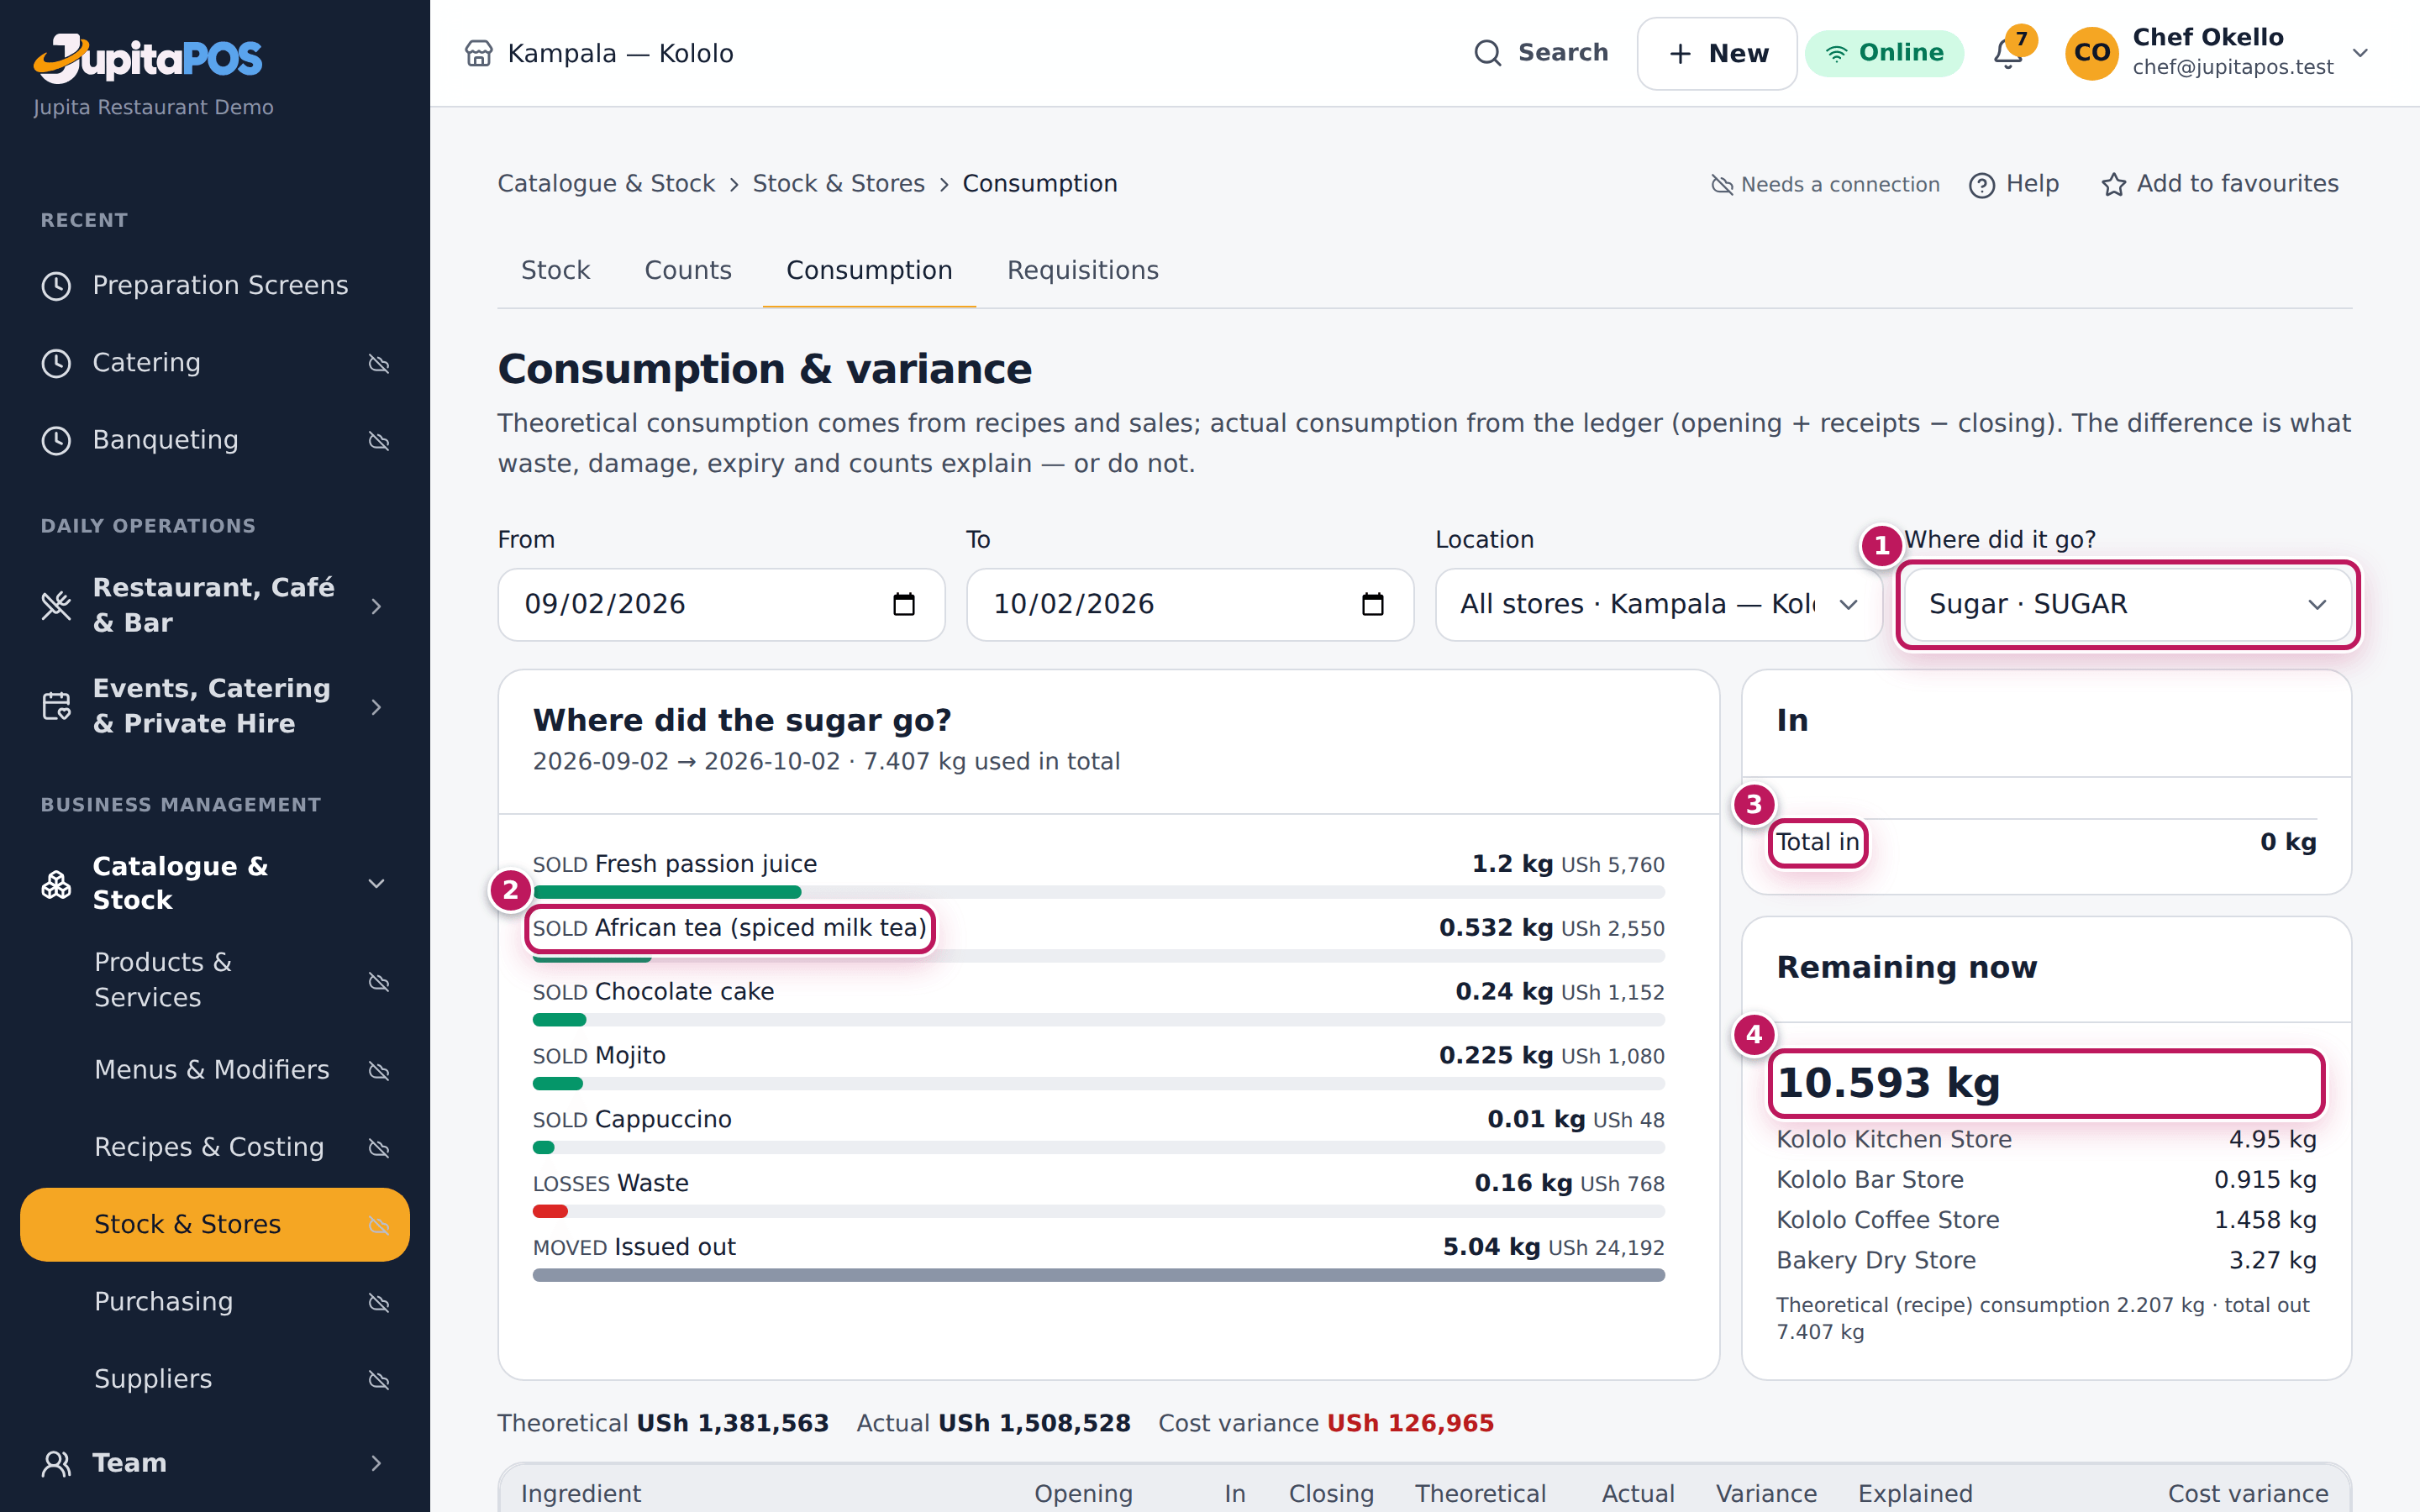
- Choose the ingredient in Where did it go? (1): Sugar · SUGAR. (Or tap an ingredient’s name in the table.)
- Read the bars (2): each use with its quantity and value, grouped as Sold, Staff meals, Events, Complimentary, Losses and Moved.
- Read In (3): the opening stock, deliveries, transfers in, count gains, and Sales reversed.
- Read Remaining now (4) and the stock per store under it.
Expected result
Where did the sugar go? lists, for Kololo and biggest first, the drinks and cakes that used sugar — such as fresh passion juice, chocolate cake and African tea — the waste, and what was issued out. The last line compares the recipes’ use (Theoretical (recipe) consumption) with everything that went out. Remaining now gives the kilograms left and which store holds them. The same report is on each item’s page, tab Where did it go?.
Screenshot
Common mistakes
- A period that starts after the delivery. Then the report cannot show where that delivery went. Start the period before it.
Troubleshooting
- “Nothing used in this period”. Nothing left the chosen stores in those dates; widen the period or choose All stores.
- A store shows a negative quantity under Remaining now. Sales used more than the store had on the books. Receive or transfer what came in, then count.